The WISE Survey was developed jointly by all the partners. During the Kick-off meeting in Milan in November 2014 and during conference calls via Skype partners have discussed student’s needs and services provided by each university. These discussions led to an agreement on which themes should be covered in the survey. A literature review was made in order to map out and utilize earlier research and publications regarding student’s needs and services. On the basis of the literature review, a map of needs was created in order to associate each service with the macro-categories of needs. The map of needs was shared, commented on and completed by all partners and finally used as a starting point for the development and implementation of the survey.
The methodology
Description of the survey
The data were collected by means of a structured survey comprising of general information (age, gender, housing, purpose of studies, employment status etc.). The survey also included specific questions for international students and students with disabilities. The survey covered six main themes of interest: Food, Housing, Financial support, Health and psychological support, Study and personal development support and Sports activities. The respondents were asked to evaluate the importance of needs (scale 1-5) connected to the above mentioned themes and to indicate the level of satisfaction (scale 1-5) regarding the services provided to meet these needs. The structure of the survey was based on the chronological phases of university studies from entry to exit (section 1-4) and specific sections for international students (section 5) and students with disabilities (section 6).
- Section 1: questions regarding student’s needs at entry and during studies, covering all six themes of interest (importance of need, scale 1-5).
- Section 2: evaluation of the services offered in the beginning of the studies, i.e. entry services: online/helpdesk service, administrative support during admission, orientation activities etc. (level of satisfaction, scale 1-5).
- Section 3: evaluation of the services offered during the studies, covering all six themes of interest (level of satisfaction, scale 1-5).
- Section 4: evaluation of the services offered during the final phase of the studies, covering all six themes of interest (level of satisfaction, scale 1-5).
- Section 5: questions to international students regarding the importance (scale 1-5) of specific needs (pre-arrival, language issues, additional economic support, administrative procedures etc.) and the services offered to meet these needs (level of satisfaction, scale 1-5).
- Section 6: questions to students with disabilities regarding the importance (scale 1-5) of specific needs (physical assistance, assistive tools, accessible facilities etc.) and the services offered to meet these needs (level of satisfaction, scale 1-5).
The common language used when developing the survey was English. The final version of the survey was then translated from English into Italian, Croatian, Polish and Swedish.
Distribution
The survey was sent out to students in all four partner countries, more specifically within the following universities:
- Croatia: The Catholic University of Croatia,
- Poland: The John Paul II Catholic University of Lublin,
- Finland: Åbo Akademi University,
- Italy: Fondazione Endisu – Ente Nazionale per il diritto allo studio e per I servizi agli studenti, ESU Padova, ESU Venezia, ESU Verona and EDUCatt – Ente per il diritto allo studio dell’ Università Cattolica.
The initial answering period for the survey was 12-27 March 2015. It was extended until 9 April in order to get more responses. Two reminders where sent out by each partner using the online survey. The survey was distributed online by partners in Italy, Poland and Finland in the languages of the host university (i.e. Italian, Polish and Swedish), with a separate link to an English version for international students. Italy and Finland used the online survey tool Surveygizmo, whereas Poland used an internal e-platform called e-KUL. Poland initiated the survey online, but changed to a paper based survey during the extended answering period in order to get a higher response rate. Croatia used a paper based survey, which was filled in by 347 of totally 438 students. By the experience in Croatia, it took 15-20 minutes to fill out the survey.
A total of 126,377 students received the survey (either by email or as a paper copy). The number of respondents was 9041 leading to a response rate of 7.1 % in total (Italy 7.3 %, Croatia 79 %, Finland 7.1 % and Poland 3.2 %).
Analysis
As the sample include 9,045 filled in questionnaires, each variable was codified according to the two scale used in the survey: a Likert scale 1-5 to identify the degree of importance of each analyzed need and a Likert scale 1-5 to identify the degree of satisfaction of each analyzed service. As the distribution of variables was not normal and the variable comprised different levels of measurement, non-parametrical test (Kruskal-Wallis) techniques were used (Siegel, 1956) to test significance of differences among identified countries (Croatia, Italy, Finland and Poland). To test our results, a confidence interval of 95% was considered.
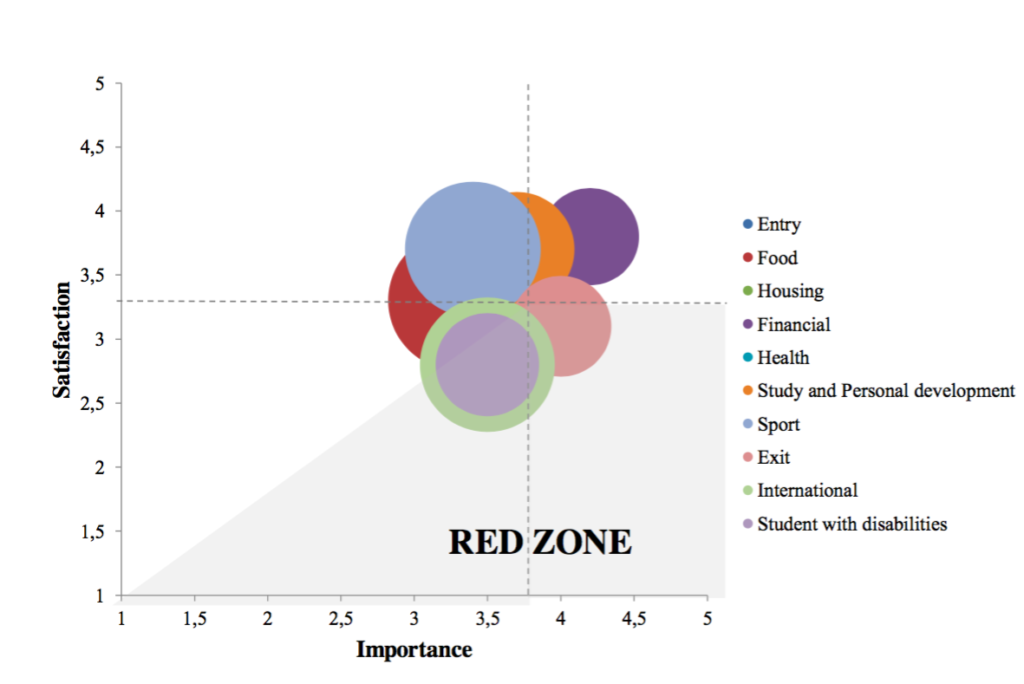
The aim of this report is to realize a so called “WISE Matrix” which is a model developed with all the partners in order to identify the services that need to be implemented and in order to find policy implications.
Specifically, the WISE Matrix is a representation of all the analyzed services analyzing two main dimensions:
- the degree of needs’ importance
- the degree of services’ satisfaction
Due to the realization of the matrix, it is possible to identify what it is called “Red Zone”. The Red zone is the zone that includes services that show the lower degree of satisfaction but the higher degree of importance. In so doing, the WISE matrix shows the services that are in the red zone and so the services that need to be implemented.
The sample
Table 1 – Response rate
| Croatia(n. 343) | Italy(n. 7,857) | Finland(n. 393) | Poland(n. 448) | Total(n. 9,041) | ||||||||||
| N | % | N | % | N | % | N | % | N | % | |||||
| Email/questionnaires delivered | 434 | 106465 | 5478 | 14000 | 126377 | |||||||||
| Completed questionnaires | 343 | 3.8 | 7857 | 86.9 | 393 | 4.3 | 448 | 5.0 | 9041 | 100 | ||||
| Response rate (%) | 79.0 | 7.3 | 7.1 | 3.2 | 7.1 | |||||||||
A total amount of 126,377 questionnaires was sent to the students in the countries of the partners involved in the WISE project, i.e. Italy, Croatia, Poland and Finland. The total number of surveys collected is 9,041 with a total response rate of 7.1%. The higher response rate is represented by Croatia, with a response rate of 79.0% and 343 questionnaires collected. On the average, Italy sent the highest number of email (106,465) with a response rate of 7.3%. On the contrary, the response rate in Poland is much lower in comparison to the average (3.2%).
Table 2 – General statistics
| Croatia(n. 343) | Italy(n. 7,857) | Finland(n. 393) | Poland(n. 448) | Total(n. 9,041) | ||||||||||
| N | % | N | % | N | % | N | % | N | % | |||||
| Gender | ||||||||||||||
| Male | 93 | 27.1 | 2,565 | 32.7 | 85 | 21.6 | 139 | 31.0 | 2,882 | 31.9 | ||||
| Female | 249 | 72.6 | 5,250 | 66.8 | 304 | 77.4 | 298 | 66.5 | 6,101 | 67.5 | ||||
| Not to disclosed | 1 | 0.3 | 42 | 0.5 | 4 | 1.0 | 11 | 2.5 | 58 | 0.6 | ||||
| Purpose of current studies | ||||||||||||||
| Bachelor | 298 | 86.9 | 4,389 | 55.9 | 166 | 42.2 | 222 | 49.6 | 5,075 | 56.1 | ||||
| Master | 45 | 13.1 | 3,355 | 42.7 | 186 | 47.3 | 200 | 44.6 | 3,786 | 41.9 | ||||
| Doctoral | 0.0 | 0.0 | 113 | 1.4 | 41 | 10.4 | 26 | 5.8 | 180 | 2.0 | ||||
| Live | ||||||||||||||
| With the family | 204 | 59,9 | 4940 | 64,9 | 51 | 15,2 | 117 | 27,3 | 5312 | 60,9 | ||||
| Outside family in a student residence | 49 | 14,5 | 286 | 3,8 | 25 | 7,5 | 39 | 9,1 | 399 | 4,6 | ||||
| Outside family in an open market apartment | 37 | 11,5 | 1630 | 21,4 | 90 | 26,9 | 195 | 45,5 | 1952 | 22,4 | ||||
| Alone in a student residence | 11 | 3,4 | 287 | 3,8 | 74 | 22,1 | 33 | 7,7 | 405 | 4,6 | ||||
| Alone in an open market apartment | 36 | 10,7 | 472 | 6,2 | 95 | 28,4 | 45 | 10,5 | 648 | 7,4 | ||||
| Employment | ||||||||||||||
| Part-time | 45 | 13.1 | 1,231 | 15.7 | 129 | 32.8 | 72 | 16.1 | 1,477 | 16.3 | ||||
| Full-time | 0 | 0.0 | 469 | 6.0 | 39 | 9.9 | 30 | 6.7 | 538 | 6.0 | ||||
| Not-employed | 298 | 86.9 | 6,157 | 78.4 | 225 | 57.3 | 346 | 77.2 | 7,026 | 77.7 | ||||
| Phases | ||||||||||||||
| Entry and during studies | 114 | 33.2 | 3,267 | 41.6 | 242 | 61.6 | 279 | 62.3 | 3,902 | 43.2 | ||||
| Exit phase | 229 | 66.8 | 4,590 | 58.4 | 151 | 38.4 | 169 | 37.7 | 5,139 | 56.8 | ||||
Concerning the gender of the students answering the questionnaire, the great majority of them are female (67.5%). Much higher than the average is the case of Finland, which shows a percentage of 77.4% of female students answering to the questionnaire. On the other hand, 31.9% of the whole considered sample is composed by male students. Consequently, Finland distinguished itself in this case as well, showing even a lower percentage (21.6%) of male students.
Regarding the purpose of current studies (bachelor, master and doctoral degree) of the interviewed students, 56.1% are bachelor students, 41.9% are master students and only 2% are doctoral students. Croatia constitutes an exception with the higher percentage of 86.9% of bachelor students and the lower percentage of master’s students (13.1%). On the other hand, Finland constitutes an exception if we consider the higher percentage of doctoral students (10.4%).
Concerning the different housing possibilities of the interviewed students: 60.9% of them still live with their families, with the exception of Finland and Poland where the situation is quite different. In Finland, the majority of the students live alone: 28.4% of these live in an open market apartment and 22.1% in a student residence, while another great part lives outside the family but with roommates: 26.9% in an open market apartment and 7.5% in a student residence. Only 15.2% of them still live with their family. In Poland, 27.3% of the students belonging to the sample live with their families, while the great majority of the students live outside the family with roommates: 45.5% in an open market apartment and 9.1% in a student residence.
With regard to the employment status of the interviewed students, the 77.7% declared themselves as not employed, with the exception of Finland. In this country, 57.3% are not employed and in consequence, the percentage of employed students is much higher in comparison to the other countries, in particular if we consider the part-time employed students: 32.8%. These data have to be connected with the information emerged from the housing possibilities, so as to the fact that the majority of the Finnish students who answered the questions live alone and have to pay for the housing and living costs they have.
About the phases of the studies, the students in the sample are grouped into three phase: the entry phase, the during studies phase and the exit phase. The majority of students, exactly the 56.8% of them are in the exit phase. Referring to the same data, the percentage is much lower in Poland (37.7%) and in Finland (38.4%), where there is the higher percentage of students in the entry and during studies phases. In fact, the total percentage of students who found themselves in the entry phase and during their studies is 43.2% and as a consequence, even in this case Poland (62.3%) and Finland (61.6%) have to be considered as exceptions.
Table 3 – Special students
| Croatia(n. 343) | Italy(n. 7,857) | Finland(n. 393) | Poland(n. 448) | Total(n. 9,041) | ||||||||||
| N | % | N | % | N | % | N | % | N | % | |||||
| International students | 0 | 0.0 | 187 | 2.4 | 32 | 8.1 | 8 | 1.8 | 227 | 2.5 | ||||
| Student with disabilities | 0 | 0.0 | 81 | 1.0 | 16 | 4.1 | 32 | 7.1 | 129 | 1.4 | ||||
The percentage of international students interviewed within the whole sample is 2.5%. The number of international students is much higher in Finland (8.1%). On the other hand, in Croatia there are no international students.
The number of student with disabilities within the whole sample shows a general percentage of 1.4%. The situation is different in Poland, which shows the higher percentage of disabled students (7.1%).
The perceived needs
Table 4 – Needs and definition
| Phase/ Perceived needs | Definition |
| A. ENTRY PHASE | |
| Need to get information about university services | The accuracy of pre-enrollment information, reasons that students chose the school in question, and whether or not the school they are attending was their first choice. |
| Need to be supported in building new relationships | Establish new friendships and relationships through welcome day or any type of initiatives in order to get the students to know each other’s and in order to introduce them to student life of the institution. |
| Need to psychometric or psychological support in order to find emotional predisposition towards a particular course of study | Receive support from friends and family, Family/peer encouragement, attend psychological meeting with specialists in order to highlight the emotional predisposition towards a particular course of study. |
| B. DURING PHASE | |
| Food needs | |
| To receive a menu with several and genuine choices | The possibility to eat menu with different choices |
| To eat meals based on healthy nutritional aspects | The menus should contain daily calorie consumption |
| To eat fresh and local food | Possibility to eat special menu with Zero-Km products |
| Friendly services | Possibility to easily access to locations, opening times flexibility |
| To use alternative food facilities | Availability of snack machines and catering service |
| Housing needs | |
| Comfortable housing | The ability to personalize rooms, minimum level of cleanliness, availability of single rooms or family student housing, possibility to live in a student house with multi-services (IT, shared kitchen, relax room) |
| Housing close to the university | Possibility to live very close to the university, availability of parking |
| Secure and safe accommodation | The possibility to provide healthy, safe, and educationally supportive living environments that complement the academic mission of the institution. The possibility to select and supervise of the student and professional staff members who live and work in campus residence halls. |
| Financial needs | |
| Financial support that covers tuition fees | Possibility to receive financial aid to help students with tuition fee with scholarships. Contributions to board and/or lodging expenses. |
| Financial support that covers further costs | Possibility to receive vouchers or subsidies that can be used to cover further costs (e.g. Free-of-charge borrowing of books from library, Special discounts to use sports facilities, Vouchers or economic help to buy books in off-campus bookshops, Vouchers or economic help to rent a car or to buy gas). |
| Health and psychological needs | |
| Need to receive primary health assistance | Availability of immediate medical assistance to students who are ill or injured. |
| Need to receive specialist health assistance | Availability of other medical assistance such as nutritionist, gynecologist, dermatologist, physiotherapist, dentist |
| Need to receive mental health assistance | Availability of pastoral support and psychological assistance to students |
| Study and personal development needs’ | |
| Need of cultural enhancement | Possibility to attend educational programs for developing academic and learning skills |
| Need of personal growth | Encourage interactions with students, counseling, mentoring |
| Need of community | Encourage social integration (degree of the student’s integration into the social environment of the institution and her or his perceived personal and social growth) |
| Need of educational planning and monitoring | Encourage course planning/choosing a degree or course of study, Monitoring and follow-up of academic progress, transfer assistance |
| Need of personal guidance and counseling | Possibility to attend orientation activities with tutors and academic advising |
| Need to develop extra-curriculum experiences | Possibility to attend Erasmus program, placement in part-time jobs. |
| Sports needs’ | |
| Need to choose among different athletic initiatives | Possibility to attend fitness programs in order to promote good health and wellness, to teach physical skills, and to encourage positive social interaction among students. |
| C. EXIT PHASE | |
| Information about job opportunities | Availability to access to placement database to find job alert |
| Job interview simulation | Availability of CV building workshop and assessment simulation. |
| Improvement of human relationship skills and professional skills | Possibility to attend meeting with ex-alumni. |
| Career development and planning | Career development specialists also help students with career exploration, planning their job search, and other skills such as resume writing, interviewing, and making effective presentations. Career development specialists may also help students locate opportunities for internships and cooperative education experiences. |
The entry phase
Table 5 – Perceived needs’ importance in the entry phase
| Croatia (n. 343) |
Italy (n. 7,855) |
Finland (n. 393) |
Poland (n. 448) |
Total (n. 9.041) |
K | ||||||||||
| M | SD | M | SD | M | SD | M | SD | M | SD | ||||||
| Need to get information about university services | 4.1 | 0.8 | 4.3 | 0.7 | 4.3 | 0.7 | 4.2 | 0.8 | 4.3 | 0.8 | * | ||||
| Need to be supported in building new relationships | 3.5 | 0.9 | 3.2 | 0.9 | 3.8 | 0.9 | 3.5 | 0.9 | 3.2 | 0.9 | * | ||||
| Need to psychometric or psychological support in order to find emotional predisposition towards a particular course of study | 3.5 | 1.0 | 3.8 | 0.9 | 3.2 | 0.9 | 3.2 | 1.0 | 3.8 | 0.9 | * | ||||
| Mean of need in the entry phase | 3.7 | 0.7 | 3.8 | 0.6 | 3.8 | 0.6 | 3.7 | 0.6 | 3.8 | 0.6 | * | ||||
* p-value <0.05; K = Kruskal–Wallis analysis of variance
Table 5 shows the perceived needs’ importance in the entry phase. The table presents means and standard deviations for each specific need among countries, together with Kruskal-Wallis (non-parametric) tests. As highlighted in the table, the total perceived importance of needs in the entry phase is 3.7. In the whole list of the entry needs, the need to get information about university services shows the higher percentage of perceived importance (4.3), especially in Italy and in Finland, where this need has the same degree of perceived importance. The need to psychometric or psychological support in order to find emotional predisposition towards a particular course of study shows a higher degree of perceived importance in Italy (3.8) than in other countries. The need to be supported in building new relationships is more relevant in Finland (3.8). On average, the needs in the entry phase are perceived as more important in Italy and in Finland (3.8). To the opposite, Poland shows a lower degree of perceived importance of needs in the entry phase (3.7). The distribution of statistics highlights that the degree of importance of each entry needs diverges among different countries, since Kruskal-Wallis tests are significant at a statistical level of 0.05 for all the perceived needs’ in the entry phase.
The during studies phase
Table 6 – Perceived needs’ importance in the during studies phase
| Croatia(n. 343) | Italy(n. 7,855) | Finland(n. 393) | Poland(n. 448) | Total(n. 9,041) | K | ||||||||||
| M | SD | M | SD | M | SD | M | SD | M | SD | ||||||
| Food needs | |||||||||||||||
| To receive a menu with several and genuine choices | 4.1 | 0.9 | 3.8 | 1.0 | 3.8 | 0.9 | 2.9 | 1.1 | 3.8 | 1.0 | * | ||||
| To eat meals based on healthy nutritional aspects | 3.4 | 1.2 | 3.3 | 1.2 | 3.7 | 0.9 | 3.2 | 1.1 | 3.3 | 1.2 | * | ||||
| To eat fresh and local food | 4.0 | 1.0 | 3.6 | 1.1 | 3.5 | 0.9 | 3.4 | 1.1 | 3.6 | 1.1 | * | ||||
| Friendly services | 4.3 | 0.8 | 3.7 | 0.9 | 3.9 | 0.7 | 3.7 | 1.0 | 3.7 | 1.0 | * | ||||
| To use alternative food facilities | 3.8 | 1.1 | 3.7 | 1.0 | 2.7 | 1.1 | 3.2 | 1.1 | 3.6 | 1.1 | * | ||||
| Mean of food need | 3.9 | 0.8 | 3.6 | 0.7 | 3.5 | 0.6 | 3.3 | 0.8 | 3.6 | 0.7 | * | ||||
| Housing needs | |||||||||||||||
| Comfortable housing | 4.1 | 1.0 | 3.8 | 1.0 | 4.1 | 0.8 | 3.5 | 1.1 | 3.8 | 1.0 | * | ||||
| Housing close to the university | 3.7 | 1.1 | 3.6 | 1.0 | 3.4 | 0.9 | 3.8 | 1.0 | 3.6 | 1.0 | * | ||||
| Secure and safe accommodation | 4.1 | 1.0 | 4.1 | 0.9 | 4.5 | 0.7 | 3.8 | 0.9 | 4.1 | 0.9 | * | ||||
| Mean of housing need | 3.9 | 0.8 | 3.8 | 0.7 | 3.9 | 0.6 | 3.7 | 0.8 | 3.8 | 0.7 | * | ||||
| Financial needs | |||||||||||||||
| Financial support that covers tuition fees | 4.1 | 0.9 | 4.5 | 0.7 | 3.9 | 1.0 | 4.3 | 0.8 | 4.4 | 0.8 | * | ||||
| Financial support that covers further costs | 4.2 | 0.9 | 4.3 | 0.8 | 4.3 | 0.8 | 4.2 | 0.9 | 4.3 | 0.8 | * | ||||
| Mean of financial need | 4.2 | 0.8 | 4.4 | 0.7 | 4.1 | 0.8 | 4.2 | 0.8 | 4.4 | 0.7 | * | ||||
| Health and psychological needs | |||||||||||||||
| Need to receive primary health assistance | 4.3 | 0.9 | 3.7 | 1.1 | 4.4 | 0.8 | 3.8 | 1.0 | 3.7 | 1.1 | * | ||||
| Need to receive specialist health assistance | 3.9 | 1.1 | 3.4 | 1.2 | 4.1 | 0.9 | 3.7 | 1.0 | 3.4 | 1.1 | * | ||||
| Need to receive mental health assistance | 3.7 | 1.1 | 3.1 | 1.1 | 3.8 | 1.0 | 3.0 | 1.0 | 3.1 | 1.1 | * | ||||
| Mean of health and psychological need | 4.0 | 0.8 | 3.4 | 0.9 | 4.1 | 0.7 | 3.5 | 0.9 | 3.4 | 0.9 | * | ||||
| Study and personal development needs | |||||||||||||||
| Need of cultural enhancement | 4.1 | 0.9 | 4.4 | 0.7 | 3.4 | 0.9 | 3.7 | 0.8 | 4.4 | 0.8 | * | ||||
| Need of personal growth | 4.3 | 0.8 | 4.5 | 0.7 | 3.9 | 0.8 | 4.2 | 0.8 | 4.5 | 0.7 | * | ||||
| Need of community | 3.7 | 1.1 | 3.3 | 1.0 | 3.9 | 0.9 | 3.6 | 0.9 | 3.4 | 1.0 | * | ||||
| Need of educational planning and monitoring | 3.8 | 1.0 | 3.6 | 1.0 | 4.0 | 0.8 | 3.4 | 1.0 | 3.7 | 1.0 | * | ||||
| Need of personal guidance and counseling | 3.6 | 1.0 | 3.0 | 1.0 | 3.9 | 0.9 | 3.2 | 1.1 | 3.1 | 1.1 | * | ||||
| Need to develop extra-curriculum experiences | 4.1 | 0.9 | 4.1 | 0.9 | 3.5 | 0.9 | 4.1 | 0.9 | 4.1 | 0.9 | * | ||||
| Mean of study and personal development need | 3.9 | 0.7 | 3.8 | 0.5 | 3.8 | 0.6 | 3.7 | 0.6 | 3.8 | 0.6 | * | ||||
| Sports needs | |||||||||||||||
| Need to choose among different athletic initiatives | 3.6 | 1.2 | 3.1 | 1.1 | 3.5 | 0.9 | 3.4 | 1.1 | 3.1 | 1.1 | * | ||||
| Mean of sports need | 3.6 | 1.2 | 3.1 | 1.1 | 3.5 | 0.9 | 3.4 | 1.1 | 3.1 | 1.1 | * | ||||
* p-value <0.05; K = Kruskal–Wallis analysis of variance
Table 6 provides an insight into the degree of importance of needs in the during of studies phase. Generally, the housing needs (3.8) and the financial needs (4.4) are perceived as more important in comparison with other needs. More specifically, the housing needs are perceived as more important in Finland (3.9), in Croatia (3.9) and in Italy (3.8). In particular, the need to live in a comfortable housing is perceived as more important in Croatia (4.1) and in Finland (4.1). Further, the need to live in a secure and safe accommodation is perceived as more important in Croatia (4.1), in Italy (4.1) and in Finland (4.5). On the other hand, in Poland, the importance of housing needs is lower (3.7), where also the need to live in comfortable housing shows the least importance (3.5) in comparison with the other countries.
Concerning the financial needs, Italy shows the highest degree of perceived importance (4.4). In particular, the need to receive financial support that covers tuitions fees (4.5) and the need to receive financial support that covers further costs (4.3) are more important in Italy in comparison with the other countries.
To the opposite, Finland shows the least degree of importance of financial needs (4.1). Specifically, the need of financial support that cover tuition fees is perceived as less important in Finland (3.9); while the need of financial support to covers further costs is perceived as less important in Croatia (4.2).
With regards to study and personal development needs, they seem to be perceived as relatively important in Croatia (3.9) and in Italy (3.8). Specifically, Italy (4.4) and Croatia (4.1) show the higher degree of perceived importance of the need of cultural enhancement and personal growth (4.5), while the need to develop extra-curriculum experiences is perceived as more important in Poland (4.1). On the other hand, in Poland, the study and personal development needs show less importance (3.7).
Regarding the food needs, Croatia (3.9) and Italy (3.6) represent the countries where the degree of importance of food needs is the highest. In particular, the need to receive a menu with several and genuine choices (4.1) and the need to use friendly services (4.3) are higher in Croatia than in other countries. On the other side, Finland (3.5) and Poland (3.3) show the lowest degree of importance of food needs. In fact, the degree of importance of the need to use alternative food facilities is the lowest in Finland (2.7), and the need to receive a menu with several and genuine choices shows less importance in Poland (2.9) in comparison with all the other countries. With regards to health and psychological needs (3.4), these needs seem to be more important in Finland (4.1). In fact, the need to receive primary health assistance (4.4), the need to receive specialist health assistance (4.1) and the need to receive mental health assistance (3.8) show the highest degree of importance in Finland in comparison with the other countries. On the other hand, Italy shows the least degree of importance of the health and psychological needs (3.4). In fact, the need to receive primary health assistance (3.7), the need to receive specialist health assistance (3.4) and the need to receive mental health assistance (3.1) are perceived as less important in Italy in comparison with the other countries. Finally, Croatia seems to show the highest degree of importance of the sport needs (3.6), which is not seen as a relevant in Italy (3.1). The distribution of statistics highlights that the degree of importance of each needs in the during studies phase diverges among different countries, since Kruskal-Wallis tests are significant at a statistical level of 0.05 for all the perceived needs’ in the during studies phase.
The exit phase
Table 7 – Perceived needs’ importance in the exit phase
| Croatia(n. 343) | Italy(n. 855) | Finland(n. 393) | Poland(n. 448) | Total(n.9.041) | K | ||||||||||
| M | SD | M | SD | M | SD | M | SD | M | SD | ||||||
| Information about job opportunities | 4.4 | 1.0 | 4.6 | 0.7 | 4.1 | 1.0 | 4.4 | 1.0 | 4.6 | 0.7 | * | ||||
| Job interview simulation | 4.2 | 1.0 | 4.0 | 0.9 | 3.1 | 1.1 | 3.6 | 1.1 | 4.0 | 1.0 | * | ||||
| Improvement of human relationship and professional skills | 4.3 | 0.9 | 4.4 | 0.7 | 3.9 | 1.0 | 3.9 | 1.1 | 4.3 | 0.8 | * | ||||
| Career development and planning | 4.4 | 0.8 | 4.0 | 0.9 | 4.0 | 1.0 | 4.2 | 1.00 | 4.1 | 0.9 | * | ||||
| Mean of need in the exit phase | 4.3 | 0.8 | 4.3 | 0.6 | 3.8 | 0.8 | 4.0 | 0.9 | 4.2 | 0.7 | * | ||||
* p-value <0.05; K = Kruskal–Wallis analysis of variance
Table 7 shows the perceived needs’ importance in the exit phase. The table presents means and standard deviations for each specific need among countries, together with Kruskal-Wallis (non-parametric) tests. Croatia shows the highest level of perceived importance (4.3) of needs in the exit phase in comparison with all the other countries. More specifically, the need to get information about job opportunities is higher in Croatia (4.4) and in Italy (4.6) than in other countries. Further, the need to career development and planning show the highest degree of importance in Croatia (4.4).
To the opposite, Finland shows the lowest degree of importance (3.8) of needs in the exit phase. In fact, the need of job interview simulation (3.1) and the need of improvement of human relationship and professional skills (3.9) show the lowest degree of importance in comparison with all the other countries.
Finally, the distribution of statistics highlights that the degree of importance of each exit need diverges among different countries, since Kruskal-Wallis tests are significant at a statistical level of 0.05 for all the perceived needs’ in the exit phase.
The services utilization
The entry phase
Table 8 – Services in the entry phase: the utilization
| Croatia | Italy | Finland | Poland | Total | K | |||||||||||
| N | M(%) | SD(%) | N | M(%) | SD(%) | N | M(%) | SD(%) | N | M(%) | SD(%) | N | M(%) | SD(%) | ||
| Online services and/or helpdesk | 319 | 86.2 | 34.5 | 7,119 | 41.1 | 49.2 | 316 | 73.1 | 44.4 | 403 | 54.3 | 49.9 | 8157 | 44.8 | 49.7 | * |
| Administrative support during admission | 343 | 93.3 | 25.0 | 7,857 | 55.8 | 49.7 | 393 | 36.6 | 48.2 | 448 | 60.0 | 49.0 | 9041 | 56.6 | 49.6 | * |
| Possibility to attend orientation activities before the enrolment | 313 | 84.7 | 36.1 | 7,500 | 56.2 | 49.6 | 351 | 72.4 | 44.8 | 407 | 41.8 | 49.4 | 8571 | 57.2 | 49.5 | * |
| Counseling activities to encourage interactions with other students | 343 | 73.8 | 44.1 | 7,857 | 21.8 | 41.3 | 393 | 70.7 | 45.6 | 448 | 34.6 | 47.6 | 9041 | 26.6 | 44.2 | * |
| Psychological meeting with specialists in order to highlight the emotional predisposition towards a particular course of study | 298 | 64.8 | 47.9 | 7,125 | 12.6 | 33.2 | 308 | 14.6 | 35.4 | 385 | 18.4 | 38.8 | 8116 | 14.8 | 35.6 | * |
| Mean of utilization in the entry phase | 343 | 79.3 | 28.4 | 7,857 | 38.1 | 27.1 | 393 | 54.4 | 27.8 | 448 | 42.5 | 31.5 | 9041 | 40.6 | 28.7 | * |
* p-value <0.05; K = Kruskal–Wallis analysis of variance
Table 8 provides an insight into the degree of utilization of services in the entry phase. The table presents number of answers, means, and standard deviations for each specific service in the entry phase among countries, together with Kruskal-Wallis (non-parametric) tests. As showed in the table, Croatia shows the highest degree of utilization of the services in the entry phase, confirming that all the services in this phase has a higher degree of utilization in comparison with all the other countries. For example, the service concerning administrative support during admission is the most used service in Croatia (93.3%). To the contrary, in Italy all the services in the entry phase are less used in comparison with all the other countries (38.1%). In fact, the services concerning psychological meeting with specialist in order to highlight the emotional predisposition towards a particular course of study show the lowest rate of utilization (12.6%). Finally, the distribution of statistics highlights that the degree of utilization of each entry service diverges among different countries, since Kruskal-Wallis tests are significant at a statistical level of 0.05 for all the services in the entry phase.
The during studies phase
Table 9 – Food Services in the during studies phase: the utilization
| Croatia | Italy | Finland | Poland | Total | K | |||||||||||
| N | M(%) | SD(%) | N | M(%) | SD(%) | N | M(%) | SD(%) | N | M(%) | SD(%) | N | M(%) | SD(%) | ||
| Offer/proposal of menus with healthy choices | 269 | 95.9 | 19.8 | 4,466 | 88.2 | 32.3 | 323 | 97.2 | 16.5 | 142 | 70.4 | 45.8 | 5200 | 88.7 | 31.7 | * |
| Offer/proposal of menus with seasonal food | 267 | 98.5 | 12.2 | 4,308 | 87.8 | 32.7 | 234 | 92.7 | 26.0 | 139 | 71.9 | 45.1 | 4948 | 88.2 | 32.3 | * |
| Menus advised by nutritionist with an healthy nutritional chart | 251 | 92.0 | 27.1 | 3,952 | 46.2 | 49.9 | 234 | 76.9 | 42.2 | 128 | 44.5 | 49.9 | 4565 | 50.3 | 50.0 | * |
| Offer/proposal of local foods | 231 | 91.3 | 28.2 | 3,676 | 72.5 | 44.7 | 174 | 87.9 | 32.7 | 130 | 63.8 | 48.2 | 4211 | 73.9 | 43.9 | * |
| Friendly canteen facilities | 268 | 98.1 | 13.6 | 4,233 | 65.6 | 47.5 | 335 | 99.4 | 7.7 | 151 | 90.1 | 30.0 | 4987 | 70.3 | 45.7 | * |
| Availability of snack machines on campus | 117 | 97.4 | 15.9 | 2,732 | 94.4 | 23.1 | 55 | 70.9 | 45.8 | 281 | 94.3 | 23.2 | 3185 | 94.1 | 23.6 | * |
| Possibility to use catering service to arrange special events within university | 81 | 49.4 | 50.3 | 2,429 | 6.5 | 24.7 | 51 | 45.1 | 50.3 | 240 | 34.2 | 47.5 | 2801 | 10.9 | 31.1 | * |
| Mean of food services utilization | 285 | 93.2 | 14.0 | 5,533 | 68.6 | 26.8 | 342 | 91.2 | 18.4 | 329 | 69.0 | 29.3 | 6489 | 70.9 | 27.0 | * |
* p-value <0.05; K = Kruskal–Wallis analysis of variance
Table 9 provides an insight into the degree of utilization of food services in the during studies phase. The table presents number of answers, means, and standard deviations for each specific food service among countries, together with Kruskal-Wallis (non-parametric) tests. More specifically, in Croatia (93.2%) and in Finland (91.2%) the food services have the highest degree of utilization in comparison with all the other countries. Among all food services, the proposal of menu with seasonal food (98.5%) and friendly canteen facilities (98.1%) are the most used services in Croatia. To the opposite, Italy (68.6%) and Poland (69.0%) show a lower rate of food services’ utilization. In particular, the catering service to arrange special event within university is the lowest used service in all the countries (10.9%). Finally, the distribution of statistics highlights that the degree of utilization of each food service diverges among different countries, since Kruskal-Wallis tests are significant at a statistical level of 0.05 for all the food services in the during studies phase.
Table 10 – Housing Services in the during studies phase: the utilization
| Croatia | Italy | Finland | Poland | Total | K | |||||||||||
| N | M(%) | SD(%) | N | M(%) | SD(%) | N | M(%) | SD(%) | N | M(%) | SD(%) | N | M(%) | SD(%) | ||
| Type of housing available | ||||||||||||||||
| Student housing near the university | 62 | 96.8 | 17.8 | 473 | 93.2 | 25.1 | 99 | 94.9 | 22.0 | 59 | 62.7 | 48.8 | 693 | 91.2 | 28.4 | * |
| Availability of single rooms | 62 | 96.8 | 17.8 | 473 | 93.2 | 25.1 | 99 | 94.9 | 22.0 | 59 | 62.7 | 48.8 | 693 | 91.2 | 28.4 | * |
| Availability of family apartments | 62 | 66.1 | 47.7 | 507 | 71.6 | 45.1 | 105 | 70.5 | 45.8 | 66 | 33.3 | 47.5 | 740 | 67.7 | 46.8 | * |
| Other housing services | ||||||||||||||||
| Safety and security of the housing facilities | 50 | 34.0 | 47.9 | 429 | 42.2 | 49.4 | 83 | 30.1 | 46.2 | 55 | 27.3 | 44.9 | 617 | 38.6 | 48.7 | * |
| Parking space near housing facility | 62 | 93.5 | 24.8 | 507 | 92.7 | 26.0 | 105 | 90.5 | 29.5 | 66 | 75.8 | 43.2 | 740 | 90.9 | 28.7 | * |
| Possibility to personalize student room(s) | 57 | 75.4 | 43.4 | 462 | 57.4 | 49.5 | 98 | 53.1 | 50.2 | 62 | 53.2 | 50.3 | 679 | 57.9 | 49.4 | * |
| Possibility to organize social events | 62 | 95.2 | 21.6 | 507 | 82.4 | 38.1 | 105 | 87.6 | 33.1 | 66 | 68.2 | 46.9 | 740 | 83.0 | 37.6 | * |
| Housing facilities | ||||||||||||||||
| Restaurant hall | 62 | 82.3 | 38.5 | 507 | 69.0 | 46.3 | 105 | 41.9 | 49.6 | 66 | 57.6 | 49.8 | 740 | 65.3 | 47.6 | * |
| Shared kitchen | 62 | 61.3 | 49.1 | 507 | 67.5 | 46.9 | 105 | 31.4 | 46.6 | 66 | 39.4 | 49.2 | 740 | 59.3 | 49.2 | * |
| Laundry room | 62 | 83.9 | 37.1 | 507 | 86.0 | 34.7 | 105 | 41.0 | 49.4 | 66 | 89.4 | 31.0 | 740 | 79.7 | 40.2 | * |
| IT facilities in the rooms | 60 | 71.7 | 45.4 | 483 | 79.7 | 40.3 | 100 | 73.0 | 44.6 | 64 | 78.1 | 41.7 | 707 | 77.9 | 41.5 | |
| Clean-up services | 61 | 91.8 | 27.7 | 493 | 96.1 | 19.3 | 99 | 83.8 | 37.0 | 64 | 92.2 | 27.0 | 717 | 93.7 | 24.3 | * |
| Study hall | 60 | 81.7 | 39.0 | 489 | 93.0 | 25.5 | 81 | 34.6 | 47.9 | 59 | 66.1 | 47.7 | 689 | 82.9 | 37.7 | * |
| Computer hall | 61 | 77.0 | 42.4 | 488 | 90.6 | 29.2 | 73 | 28.8 | 45.6 | 63 | 69.8 | 46.3 | 685 | 80.9 | 39.4 | * |
| Relaxation room | 53 | 41.5 | 49.7 | 468 | 75.4 | 43.1 | 77 | 40.3 | 49.4 | 59 | 44.1 | 50.1 | 657 | 65.8 | 47.5 | * |
| Prayer room | 57 | 49.1 | 50.4 | 463 | 76.9 | 42.2 | 84 | 39.3 | 49.1 | 54 | 33.3 | 47.6 | 658 | 66.1 | 47.4 | * |
| Gym facilities | 55 | 60.0 | 49.4 | 460 | 48.9 | 50.0 | 71 | 15.5 | 36.4 | 61 | 77.0 | 42.4 | 647 | 48.8 | 50.0 | * |
| Movie hall | 59 | 59.3 | 49.5 | 445 | 61.1 | 48.8 | 77 | 20.8 | 40.8 | 56 | 30.4 | 46.4 | 637 | 53.4 | 49.9 | * |
| Mean of housing services utilization | 62 | 74.3 | 16.4 | 507 | 76.5 | 18.8 | 105 | 57.5 | 20.7 | 66 | 59.6 | 27.5 | 740 | 72.1 | 21.2 | * |
* p-value <0.05; K = Kruskal–Wallis analysis of variance
Table 10 provides an insight into the degree of utilization of housing services in the during studies phase. The table presents number of answers, means, and standard deviations for each specific housing service among countries, together with Kruskal-Wallis (non-parametric) tests. Generally, Italy shows the highest rate of housing services’ utilization (76.5%), while Finland displays the lowest utilization rate (57.5%). Focusing on the type of housing available, Croatia shows the highest usage percentage of single rooms (96.8%) and student housing near the university (96.8%). To the opposite, in Poland, the use of student housing near the university (62.7%), the use of single rooms (62.7%) and the use of family apartment (33.3%) is the lowest in comparison with all the other countries. Regarding the types of housing, an exception is represented by Italy that shows the highest usage percentage of family apartments (71.6%) in comparison with other countries.
Concerning the housing facilities, Italy shows the highest percentage usage of almost housing facilities. An exception is represented by restaurant hall facilities, where Croatia shows the highest percentage usage (82.3%). On the contrary, Finland shows the lowest percentage of usage of almost housing facilities.
Regarding the other housing services, Croatia shows the highest usage percentage of parking space near housing facilities (93.5%), but also a higher percentage regarding the organization of social events (95.2%) and the personalization of student’s rooms (75.4%). To the opposite, Poland represents the lowest usage percentage rate of all the other housing services. In fact, Poland shows the lowest usage percentage of safety and security of the housing facilities (27.3%) in comparison with all the other countries.
Finally, the distribution of statistics highlights that the degree of utilization of each housing service diverges among different countries, since Kruskal-Wallis tests are significant at a statistical level of 0.05 for almost the housing services in the during studies phase. Kruskal-Wallis test is not significant referring to the use of IT facilities in the rooms.
Table 11 – Financial services in the during studies phase: the utilization
| Croatia | Italy | Finland | Poland | Total | K | |||||||||||
| N | M(%) | SD(%) | N | M(%) | SD(%) | N | M(%) | SD(%) | N | M(%) | SD(%) | N | M(%) | SD(%) | ||
| Availability of scholarships to cover tuition/enrolment fees | 97 | 75,3 | 43,4 | 1,785 | 80.3 | 39.8 | 120 | 77.5 | 41.9 | 88 | 77.3 | 42.1 | 2090 | 79,8 | 40,2 | * |
| Possibility to get degree awards | 89 | 20,2 | 40,4 | 1,590 | 21.3 | 40.9 | 111 | 15.3 | 36.2 | 76 | 14.5 | 35.4 | 1866 | 20,6 | 40,4 | * |
| Special benefit/subvention for student canteen | 96 | 63,5 | 48,4 | 1,819 | 76.2 | 42.6 | 119 | 62.2 | 48.7 | 86 | 63.9 | 48.3 | 2120 | 74,4 | 43,7 | * |
| Special benefit/subvention for student housing | 96 | 31,3 | 46,6 | 1,739 | 28.3 | 45.1 | 121 | 31.4 | 46.6 | 85 | 24.7 | 43.4 | 2041 | 28,5 | 45,2 | * |
| Special menu discount price for students who eat in off-campus restaurants/bar | 96 | 32,3 | 47,0 | 1,721 | 29.4 | 45.6 | 117 | 22.2 | 41.7 | 84 | 21.4 | 41.3 | 2018 | 28,8 | 45,3 | * |
| Availability to use restaurant tickets at canteen | 88 | 20,5 | 40,6 | 1,686 | 24.4 | 42.9 | 123 | 17.9 | 38.5 | 84 | 19.0 | 39.5 | 1981 | 23,6 | 42,5 | |
| Free-of-charge borrowing of books from library | 95 | 65,3 | 47,9 | 1,831 | 64.7 | 47.8 | 122 | 64.7 | 48.0 | 85 | 71.8 | 45.3 | 2133 | 65,0 | 47,7 | * |
| Special discounts to use sports facilities | 95 | 16,8 | 37,6 | 1,729 | 20.8 | 40.6 | 119 | 10.9 | 31.3 | 84 | 16.7 | 37.5 | 2027 | 19,8 | 39,9 | * |
| Vouchers or economic help to buy books in off-campus bookshops | 91 | 19,8 | 40,1 | 1,683 | 16.2 | 36.8 | 112 | 13.4 | 34.2 | 78 | 12.8 | 33.6 | 1964 | 16,0 | 36,7 | |
| Vouchers or economic help to rent a car or to buy gas | 88 | 5,7 | 23,3 | 1,651 | 6.2 | 24.2 | 115 | 6.1 | 24.0 | 78 | 3.8 | 19.4 | 1932 | 6,1% | 24,0 | |
| Vouchers or economic help to pay public transportation | 96 | 19,8 | 40,1 | 1,715 | 29.5 | 45.6 | 116 | 21.5 | 41.3 | 83 | 16.9 | 37.7 | 2010 | 28,0 | 44,9 | * |
| Financial coverage for health and mental care | 89 | 12,4 | 33,1 | 1,695 | 20.8 | 40.6 | 116 | 12.9 | 33.7 | 84 | 7.1 | 25.9 | 1984 | 19,4 | 39,6 | * |
| Mean of financial services utilization, | 106 | 36,7 | 27,2 | 1,911 | 39.0 | 26.9 | 129 | 32.6 | 22.0 | 94 | 33.4 | 25.0 | 2240 | 38,3 | 26,7 | * |
* p-value <0.05; K =, Kruskal–Wallis analysis of variance
Table 11 provides an insight into the degree of utilization of financial services in the during studies phase. The table presents number of answers, means, and standard deviations for each specific financial service among countries, together with Kruskal-Wallis (non-parametric) tests. Italy shows the highest percentage of usage of financial services (39.0%). More specifically, in Italy the usage percentage of scholarships to cover tuition fees is the highest (80.3%) in comparison to all the other countries.
Not only the availability of scholarships is higher but also the possibility to get degree awards (21.3%) and the availability of special benefits for student canteen (76.2%) are higher than in other countries. Results also evidence that in Croatia, there is a high percentage of usage of special subventions for student housing (31.3%) and special menu discounts for students who eat in off-campus restaurants (32.3%). To the opposite, Finland (32.6%) and Poland (33.4%) present a lower percentage of usage of financial services. In particular, Poland shows the lowest percentage of usage of vouchers to buy rent a car or to buy gas (3.8%), while Finland displays the lowest percentage of usage of degree awards (15.3%). The distribution of statistics highlights that the degree of utilization of each financial service diverges among different countries, since Kruskal-Wallis tests are significant at a statistical level of 0.05 for almost the financial services in the during studies phase. Kruskal-Wallis test is not significant referring to the use of vouchers to buy books in off-campus bookshops and to the use of vouchers to rent a car or buy gas.
Table 12 – Health and psychological services in the during studies phase: the utilization
| Croatia | Italy | Finland | Poland | Total | K | |||||||||||
| N | M(%) | SD(%) | N | M(%) | SD(%) | N | M(%) | SD(%) | N | M(%) | SD(%) | N | M(%) | SD(%) | ||
| Primary health care services | 163 | 98,2 | 13,5 | 484 | 58.5 | 49.3 | 224 | 85.3 | 35.5 | 95 | 88.4 | 32.2 | 966 | 74,3 | 43,7 | * |
| Specialist health care services | 149 | 83,2 | 37,5 | 475 | 43.8 | 49.7 | 221 | 81.0 | 39.3 | 89 | 56.2 | 49.9 | 934 | 60,1 | 49,0 | * |
| Mental health care services | 141 | 35,5 | 48,0 | 468 | 29.7 | 45.7 | 216 | 35.6 | 48.0 | 90 | 23.3 | 42.5 | 915 | 31,4 | 46,4 | * |
| Pastoral support | 149 | 53,0 | 50,1 | 477 | 21.8 | 41.3 | 207 | 4.8 | 21.5 | 91 | 45.1 | 50.0 | 924 | 25,3 | 43,5 | |
| Mean of health and psychological services utilization | 164 | 71,0 | 27,8 | 501 | 40.5 | 24.3 | 231 | 54.3 | 24.3 | 102 | 56.7 | 31.1 | 998 | 50,3 | 28,0 | * |
* p-value <0.05; K = Kruskal–Wallis analysis of variance
Table 12 provides an insight into the degree of utilization of health and psychological services in the during studies phase. The table presents number of answers, means, and standard deviations for each specific health and psychological service among countries, together with Kruskal-Wallis (non-parametric) tests. Specifically, Croatia shows the highest usage percentage of health and psychological services (71%), with the highest degree of usage of primary health care services (98.2%), specialist health care services (83.2%) and pastoral support (53%). To the opposite, Italy shows the lowest percentage of usage of health and psychological services (40.5%). In particular, results suggest that in Italy the primary health care services display the lowest degree of usage (58.5%) in comparison with all the other countries. Finally, in Poland the mental health care services are less used in comparison with Croatia and Italy, while Finland shows the lowest usage percentage of pastoral support (4.8%). The distribution of statistics highlights that the degree of utilization of each health and psychological service diverges among different countries, since Kruskal-Wallis tests are significant at a statistical level of 0.05 for almost the health and psychological services in the during studies phase. Kruskal-Wallis test is not significant referring to the use of pastoral support service.
Table 13 – Personal development services in the during studies phase: the utilization
| Croatia | Italy | Finland | Poland | Total | K | |||||||||||
| N | M(%) | SD(%) | N | M(%) | SD(%) | N | M(%) | SD(%) | N | M(%) | SD(%) | N | M(%) | SD(%) | ||
| Possibility to be engaged in volunteer jobs | 217 | 72,8 | 44,6 | 1,679 | 18.8 | 39.1 | 83 | 32.5 | 47.1 | 115 | 60.0 | 49.2 | 2094 | 27,2 | 44,5 | * |
| Opportunities of occasional jobs during studies | 209 | 80,4 | 39,8 | 1,689 | 22.2 | 41.6 | 88 | 67.0 | 47.3 | 112 | 36.6 | 48.4 | 2098 | 30,6 | 46,1 | * |
| Tutoring advisor | 212 | 81,6 | 38,8 | 1,798 | 64.0 | 48.0 | 98 | 91.8 | 27.5 | 106 | 13.2 | 34.0 | 2214 | 64,5 | 47,9 | * |
| Educational programs for developing academic and learning skills | 211 | 81,5 | 38,9 | 1,703 | 41.8 | 49.3 | 95 | 73.7 | 44.3 | 111 | 54.1 | 50.1 | 2120 | 47,8 | 50,0 | * |
| Cultural activities for students | 213 | 91,1 | 28,6 | 1,748 | 60.2 | 49.0 | 86 | 68.6 | 46.7 | 115 | 69.6 | 46.2 | 2162 | 64,1 | 48,0 | * |
| Programs for student exchange and studies abroad | 210 | 64,3 | 48,0 | 1,719 | 23.7 | 42.5 | 83 | 33.7 | 47.6 | 109 | 17.4 | 38.1 | 2121 | 27,8 | 44,8 | * |
| Counseling for development of personal skills and ambitions | 204 | 61,3 | 48,8 | 1,727 | 34.8 | 47.6 | 86 | 44.2 | 50.0 | 109 | 28.4 | 45.3 | 2126 | 37,4 | 48,4 | * |
| Student unions | 213 | 57,7 | 49,5 | 1,729 | 23.7 | 42.5 | 94 | 74.5 | 43.8 | 118 | 72.0 | 45.1 | 2154 | 31,9 | 46,6 | * |
| Publishing activities | 200 | 45,5 | 49,9 | 1,707 | 14.1 | 34.8 | 88 | 47.7 | 50.2 | 109 | 30.3 | 46.2 | 2104 | 19,3 | 39,5 | * |
| Mean of personal development services utilization | 221 | 71,6 | 29,2 | 1,868 | 35.9 | 25.3 | 102 | 63.0 | 26.3 | 124 | 46.7 | 29.9 | 2315 | 41,1 | 28,4 | * |
* p-value <0.05; K = Kruskal–Wallis analysis of variance
Table 13 provides an insight into the degree of utilization of personal development services in the during studies phase. The table presents number of answers, means, and standard deviations for each specific need among countries, together with Kruskal-Wallis (non-parametric) tests. Going deeply, Croatia (71.6%) and Finland (63.0%) show the highest usage percentages for personal and development services. Specifically, in Croatia the possibilities to get opportunities of occasional jobs and during studies (80.4%) and the cultural activities for students (91.4%) are more used in comparison with other countries. Further, Finland shows the highest degree of use tutoring advisor (91.8%) than other countries.
On the other hand, in Italy, the personal development services are less used (35.9%). In particular, the possibility to be engaged in volunteer jobs displays the lowest usage percentage (18.8%). Further, in Poland, the programs for student exchange (17.4%) and counseling activities (28.4%) for development of personal skills are less used in comparison with Italy and Croatia. The distribution of statistics highlights that the degree of utilization of each personal development service diverges among different countries, since Kruskal-Wallis tests are significant at a statistical level of 0.05 for all the personal development services in the during studies phase.
Table 14 – Sport services in the during studies phase: the utilization
| Croatia | Italy | Finland | Poland | Total | K | |||||||||||
| N | M(%) | SD(%) | N | M(%) | SD(%) | N | M(%) | SD(%) | N | M(%) | SD(%) | N | M(%) | SD(%) | ||
| Intra and intercollegiate athletics | 25 | 52.0 | 51.0 | 403 | 59.3 | 49.2 | 20 | 50.0 | 51.3 | 17 | 52.9 | 51.5 | 465 | 58.3 | 49.4 | |
| Fitness program in a campus-based sports center | 26 | 57.7 | 50.4 | 409 | 59.2 | 49.2 | 20 | 60.0 | 50.3 | 20 | 75.0 | 44.4 | 475 | 59.8 | 49.1 | |
| Mean of sport services utilization | 27 | 57.4 | 35.9 | 432 | 60.9 | 33.7 | 20 | 55.0 | 35.9 | 20 | 65.0 | 36.6 | 499 | 60.6 | 33.9 | |
* p-value <0.05; K = Kruskal–Wallis analysis of variance
Table 14 provides an insight into the degree of utilization of sport services in the during studies phase. The table presents number of answers, means, and standard deviations for each specific need among countries, together with Kruskal-Wallis (non-parametric) tests. More specifically, Poland displays the highest usage percentage (65.0%) of sport services. In particular, the use of fitness program in campus-based sport centers is higher in Poland (75.0%) than in other countries, while the use of intra and intercollegiate athletics activities is higher in Italy (59.3%) than in other countries. Finally, Finland displays the lowest usage percentage of sport services (55.0%). The distribution of statistics highlights that the degree of utilization of each sport service doesn’t diverge among different countries, since Kruskal-Wallis tests are not significant.
The exit phase
Table 15 – Services in the exit phase: the utilization
| Croatia | Italy | Finland | Poland | Total | K | |||||||||||
| N | M (%) |
SD (%) |
N | M(%) | SD(%) | N | M(%) | SD(%) | N | M(%) | SD(%) | N | M(%) | SD(%) | ||
| Career orientation meeting with an advisor | 142 | 38.0 | 48.7 | 4,115 | 12.4 | 33.0 | 124 | 12.9 | 33.7 | 150 | 29.3 | 45.7 | 4,531 | 13.8 | 34.5 | * |
| A database of available jobs and placements to help students in finding work opportunities | 145 | 54.5 | 50.0 | 4,109 | 31.0 | 46.2 | 132 | 59.8 | 49.2 | 153 | 48.4 | 50.1 | 4,539 | 33.2 | 47.1 | * |
| A meeting with alumni | 139 | 36.0 | 48.2 | 4,156 | 19.6 | 39.7 | 126 | 23.8 | 42.8 | 156 | 32.1 | 46.8 | 4,577 | 20.6 | 40.5 | * |
| Job interviews simulations | 146 | 40.4 | 49.2 | 4,122 | 10.2 | 30.2 | 124 | 11.3 | 31.8 | 151 | 29.8 | 45.9 | 4,543 | 11.8 | 32.3 | * |
| CV-development workshop | 150 | 48.0 | 50.1 | 4,115 | 14.1 | 34.9 | 127 | 22.0 | 41.6 | 158 | 32.3 | 46.9 | 4,550 | 16.1 | 36.8 | * |
| Mean of utilization in the exit phase | 156 | 46.4 | 44.6 | 4,379 | 19.0 | 27.7 | 144 | 31.2 | 35.3 | 162 | 35.9 | 37.5 | 4,841 | 20.8 | 29.6 | * |
* p-value <0.05; K = Kruskal–Wallis analysis of variance
Table 15 provides an insight into the degree of utilization of services in the exit phase. The table presents number of answers, means, and standard deviations for each specific need among countries, together with Kruskal-Wallis (non-parametric) tests. More specifically, Croatia displays the highest usage percentage of services in the exit phase (46.4%). In particular, the most used service in this phase is the availability of a database in order to help students to find work opportunities (54.5%). In this direction, in Finland, the possibility to have a database with job opportunities shows the highest usage percentage (59.8%) in comparison with all the other countries. Moreover, job interview simulations (40.4%) and CV-development workshop (48.0%) are more used in Croatia than in other countries, To the opposite, in Italy all the services analyzed in the exit phase show the lowest usage percentage (19.0%). In particular, job interview simulations (10.2%) and career orientation meeting with an advisor (12.4%) are less used in comparison with other countries. Finally, the distribution of statistics highlights that the degree of utilization of each service in the exit phase diverges among different countries, since Kruskal-Wallis tests are significant at a statistical level of 0.05 for all the services in the exit phase.
The services satisfaction
The entry phase
Table 16 – Services in the entry phase: the satisfaction
| Croatia | Italy | Finland | Poland | Total | K | |||||||||||
| N | M | SD | N | M | SD | N | M | SD | N | M | SD | N | M | SD | ||
| Online services and/or helpdesk | 275 | 3.8 | 0.9 | 2,928 | 3.0 | 0.9 | 231 | 3.5 | 0.7 | 219 | 3.4 | 1.0 | 3,653 | 3.1 | 0.9 | * |
| Administrative support during admission | 320 | 4.0 | 0.9 | 4,388 | 3.0 | 1.0 | 144 | 3.4 | 0.8 | 269 | 3.3 | 1.1 | 5,121 | 3.1 | 1.0 | * |
| Possibility to attend orientation activities before the enrolment | 265 | 3.5 | 1.0 | 4,212 | 3.3 | 1.0 | 254 | 3.7 | 0.9 | 170 | 3.4 | 1.2 | 4,901 | 3.3 | 1.0 | * |
| Counseling activities to encourage interactions with other students | 253 | 3.5 | 1.0 | 1,716 | 2.7 | 1.2 | 278 | 3.6 | 1.0 | 155 | 3.1 | 1.1 | 2,402 | 2.9 | 1.2 | * |
| Psychological meeting with specialists in order to highlight the emotional predisposition towards a particular course of study | 193 | 3.1 | 1.1 | 896 | 2.5 | 1.2 | 45 | 3.3 | 1.2 | 71 | 2.7 | 1.1 | 1,205 | 2.7 | 1.2 | * |
| Mean of satisfaction in the entry phase | 331 | 3.6 | 0.8 | 6,580 | 3.1 | 0.9 | 357 | 3.6 | 0.7 | 359 | 3.3 | 0.9 | 7,627 | 3.1 | 0.9 | * |
* p-value <0.05; K = Kruskal–Wallis analysis of variance
Table 16 provides an insight into the degree of satisfaction of services in the entry phase. The table presents number of answers, means, and standard deviations for each specific need among countries, together with Kruskal-Wallis (non-parametric) tests. Going deeply, in Croatia and in Finland (3.6) the degree of satisfaction of services in the entry phase is higher in comparison with other countries. In particular, the administrative support during admission displays the highest level of satisfaction in Croatia (4.0), while the possibility to attend orientation activities before the enrollment shows the highest satisfaction level in Finland (3.7). On the other hand, in Italy all the services in the entry phase show the lowest degree of satisfaction (3.1). In particular, psychological meeting with specialists in order to highlight emotional predisposition towards a particular course of study is the lowest (2.5) in comparison with other countries. Finally, the distribution of statistics highlights that the degree of satisfaction of each service in the entry phase diverges among different countries, since Kruskal-Wallis tests are significant at a statistical level of 0.05 for all the services in the entry phase.
The during studies phase
Table 17 – Food services in the during studies phase: the satisfaction
| Croatia | Italy | Finland | Poland | Total | K | |||||||||||
| N | M | SD | N | M | SD | N | M | SD | N | M | SD | N | M | SD | ||
| Offer/proposal of menus with healthy choices | 258 | 2.8 | 1.1 | 3,938 | 3.1 | 1.0 | 314 | 3.8 | 0.9 | 100 | 3.2 | 1.1 | 4,610 | 3.1 | 1.0 | * |
| Offer/proposal of menus with seasonal food | 263 | 2.9 | 1.0 | 3,782 | 3.0 | 1.0 | 217 | 3.5 | 0.9 | 100 | 3.3 | 1.1 | 4,362 | 3.0 | 1.0 | * |
| Menus advised by nutritionist with an healthy nutritional chart | 231 | 2.2 | 1.0 | 1,827 | 2.7 | 1.1 | 180 | 3.5 | 1.0 | 57 | 2.7 | 1.1 | 2,295 | 2.7 | 1.1 | * |
| Offer/proposal of local foods | 211 | 2.3 | 1.1 | 2,665 | 2.8 | 1.0 | 153 | 3.3 | 1.1 | 83 | 3.3 | 1.2 | 3,112 | 2.8 | 1.1 | * |
| “Friendly” canteen facilities | 263 | 3.4 | 1.0 | 2,776 | 3.0 | 1.0 | 333 | 4.1 | 0.9 | 136 | 3.6 | 1.1 | 3,508 | 3.2 | 1.1 | * |
| Availability of snack machines on campus | 114 | 2.3 | 1.1 | 2,578 | 3.1 | 1.0 | 39 | 3.2 | 1.0 | 265 | 3.4 | 1.0 | 2,996 | 3.1 | 1.0 | * |
| Possibility to use catering service to arrange special events within university | 40 | 2.9 | 1.5 | 159 | 2.8 | 1.3 | 23 | 3.4 | 1.1 | 82 | 3.5 | 1.1 | 304 | 3.1 | 1.3 | * |
| Mean of food services satisfaction | 284 | 2.7 | 0.8 | 5,349 | 3.0 | 0.8 | 341 | 3.7 | 0.7 | 315 | 3.3 | 0.9 | 6,289 | 3.1 | 0.9 | * |
* p-value <0.05; K = Kruskal–Wallis analysis of variance
Table 17 provides an insight into the degree of satisfaction of food services in the during studies phase. The table presents number of answers, means, and standard deviations for each specific need among countries, together with Kruskal-Wallis (non-parametric) tests. More specifically, Finland shows the highest degree of satisfaction regarding food services (3.7). In particular, the proposal of menus with healthy choices (3.8) and the availability of friendly canteen facilities are the service with the highest satisfaction rate in Finland. To the opposite, in Croatia all the food services show the lowest satisfaction rate (2.7). Specifically, the proposal of local food is the services with the lowest satisfaction degree (2.3). Finally, the distribution of statistics highlights that the degree of satisfaction of each food service diverges among different countries, since Kruskal-Wallis tests are significant at a statistical level of 0.05 for all the food services in the during studies phase.
Table 18 – Housing services in the during studies phase: the satisfaction
| Croatia | Italy | Finland | Poland | Total | K | |||||||||||
| N | M | SD | N | M | SD | N | M | SD | N | M | SD | N | M | SD | ||
| Student housing near the university | 60 | 3.4 | 1.1 | 441 | 3.9 | 1.2 | 94 | 4.0 | 0.9 | 37 | 3.3 | 1.1 | 632 | 3.8 | 1.1 | * |
| Availability of single rooms | 41 | 2.7 | 1.6 | 363 | 3.9 | 1.2 | 74 | 4.0 | 0.9 | 22 | 2.6 | 1.5 | 500 | 3.7 | 1.3 | * |
| Availability of family apartments | 17 | 2.4 | 1.3 | 181 | 1.9 | 1.1 | 25 | 4.0 | 0.8 | 15 | 2.7 | 1.4 | 238 | 2.2 | 1.3 | * |
| Safety and security of the housing facilities | 58 | 3.7 | 1.1 | 470 | 3.9 | 1.1 | 95 | 4.0 | 0.9 | 50 | 3.5 | 1.1 | 673 | 3.9 | 1.1 | * |
| Parking space near housing facility | 43 | 4.0 | 1.2 | 265 | 2.8 | 1.5 | 52 | 3.5 | 1.3 | 33 | 3.1 | 1.4 | 393 | 3.0 | 1.5 | * |
| Possibility to personalize student room(s) | 59 | 3.8 | 1.2 | 418 | 3.1 | 1.3 | 92 | 4.0 | 1.0 | 45 | 3.1 | 1.3 | 614 | 3.3 | 1.3 | * |
| Possibility to organize social events | 51 | 3.3 | 1.5 | 350 | 3.0 | 1.2 | 44 | 3.2 | 1.3 | 38 | 2.7 | 1.3 | 483 | 3.0 | 1.3 | * |
| Restaurant hall | 52 | 3.0 | 1.2 | 342 | 3.0 | 1.2 | 33 | 3.6 | 0.9 | 26 | 3.1 | 1.4 | 590 | 2.8 | 1.2 | * |
| Shared kitchen | 43 | 3.5 | 1.2 | 436 | 2.8 | 1.2 | 43 | 2.6 | 1.1 | 59 | 3.2 | 1.2 | 551 | 3.1 | 1.1 | |
| Laundry room | 56 | 3.4 | 1.3 | 385 | 3.0 | 1.1 | 73 | 3.6 | 1.0 | 50 | 3.4 | 1.1 | 672 | 2.9 | 1.3 | * |
| IT facilities in the rooms | 49 | 3.1 | 1.3 | 474 | 2.7 | 1.3 | 83 | 3.9 | 1.0 | 59 | 3.1 | 1.3 | 571 | 3.1 | 1.2 | * |
| Clean-up services | 47 | 3.5 | 1.2 | 455 | 3.0 | 1.2 | 28 | 3.5 | 0.9 | 39 | 3.5 | 1.0 | 554 | 3.3 | 1.2 | * |
| Study hall | 22 | 2.4 | 1.6 | 442 | 3.3 | 1.2 | 21 | 3.8 | 1.0 | 44 | 3.4 | 1.1 | 432 | 2.8 | 1.2 | |
| Computer hall | 28 | 2.8 | 1.7 | 353 | 2.8 | 1.2 | 31 | 3.6 | 0.8 | 26 | 2.7 | 1.0 | 435 | 3.0 | 1.3 | * |
| Relaxation room | 33 | 3.4 | 1.6 | 356 | 3.0 | 1.2 | 33 | 3.3 | 1.2 | 18 | 2.9 | 1.4 | 316 | 3.8 | 1.2 | |
| Prayer room | 35 | 3.3 | 1.3 | 225 | 3.7 | 1.1 | 11 | 3.9 | 1.0 | 47 | 4.2 | 1.0 | 340 | 2.8 | 1.3 | * |
| Gym facilities | 38 | 3.3 | 1.2 | 272 | 2.7 | 1.3 | 16 | 3.1 | 1.3 | 17 | 2.9 | 1.2 | 230 | 3.0 | 1.3 | |
| Movie hall | 38 | 2.9 | 1.5 | 146 | 2.8 | 1.4 | 11 | 3.1 | 1.0 | 35 | 3.2 | 1.3 | 439 | 3.0 | 1.2 | |
| Mean of housing services satisfaction | 62 | 3.3 | 1.0 | 502 | 3.1 | 0.7 | 103 | 3.8 | 0.6 | 65 | 3.2 | 0.9 | 732 | 3.2 | 0.8 | * |
* p-value <0.05; K = Kruskal–Wallis analysis of variance
Table 18 provides an insight into the degree of satisfaction of housing services in the during studies phase. The table presents number of answers, means, and standard deviations for each specific need among countries, together with Kruskal-Wallis (non-parametric) tests. With regards to housing services, Finland shows the highest degree of satisfaction rate (3.8). Results evidence that the availability of student housing near the university (4.0), the availability of single rooms and family apartments (4.0), the safety and security of housing facilities (4.0) and the possibility to personalize student rooms (4.0) are the services which the highest satisfaction rate in Finland in comparison with all the other countries. Further, in Croatia, some services, such as the possibility of parking space near housing facilities (4.0) or the possibility to organize social events (3.3) display a higher satisfaction rate. On the other side, Italy shows the lowest satisfaction rate (3.1) concerning housing services. In particular, the availability of family apartments (1.9), but also the availability of IT facilities in the rooms (2.7) displays a lower satisfaction rate. The distribution of statistics highlights that the degree of satisfaction of each housing service diverges among different countries, since Kruskal-Wallis tests are significant at a statistical level of 0.05 for almost the housing services in the during studies phase. Kruskal-Wallis tests are not significant referring to five out of housing services.
Table 19 – Financial services in the during studies phase: the satisfaction
| Croatia | Italy | Finland | Poland | Total | K | |||||||||||
| N | M | SD | N | M | SD | N | M | SD | N | M | SD | N | M | SD | ||
| Availability of scholarships to cover tuition/enrolment fees | 95 | 3.2 | 1.1 | 1,427 | 3.8 | 1.1 | 87 | 3.5 | 1.2 | 56 | 3.8 | 1.1 | 1,665 | 3.8 | 1.2 | * |
| Possibility to get degree awards (additional scholarships for students who graduate within recommended study time) | 61 | 2.7 | 1.3 | 286 | 3.6 | 1.4 | 22 | 3.2 | 1.4 | 12 | 3.8 | 1.7 | 381 | 3.5 | 1.4 | * |
| Special benefit/subvention for student canteen | 121 | 3.6 | 1.1 | 1,175 | 4.0 | 1.0 | 267 | 4.5 | 0.7 | 11 | 3.5 | 1.6 | 1,574 | 4.0 | 1.0 | * |
| Special benefit/subvention for student housing | 64 | 3.2 | 1.2 | 281 | 3.8 | 1.1 | 152 | 3.9 | 1.1 | 82 | 3.7 | 1.2 | 579 | 3.7 | 1.1 | * |
| Special menu discount price for students who eat in off-campus restaurants/bar | 57 | 2.2 | 1.3 | 317 | 3.2 | 1.3 | 172 | 3.6 | 1.0 | 32 | 3.8 | 1.3 | 578 | 3.3 | 1.3 | * |
| Availability to use restaurant tickets at canteen | 54 | 2.3 | 1.4 | 376 | 3.8 | 1.1 | 19 | 3.2 | 1.2 | 15 | 3.1 | 1.4 | 464 | 3.6 | 1.3 | * |
| Free-of-charge borrowing of books from library | 100 | 3.4 | 1.3 | 922 | 4.1 | 0.9 | 261 | 4.5 | 0.7 | 102 | 4.2 | 1.0 | 1,385 | 4.1 | 1.0 | * |
| Special discounts to use sports facilities | 72 | 2.9 | 1.2 | 130 | 2.8 | 1.2 | 153 | 3.8 | 0.9 | 44 | 3.6 | 1.2 | 399 | 3.3 | 1.2 | * |
| Vouchers or economic help to buy books in off-campus bookshops | 66 | 2.4 | 1.3 | 168 | 2.8 | 1.3 | 50 | 3.1 | 1.1 | 28 | 3.3 | 1.3 | 312 | 2.8 | 1.3 | * |
| Vouchers or economic help to rent a car or to buy gas | 40 | 2.2 | 1.3 | 53 | 2.7 | 1.4 | 11 | 3.4 | 1.5 | 11 | 3.5 | 1.9 | 115 | 2.6 | 1.4 | * |
| Vouchers or economic help to pay public transportation | 105 | 3.0 | 1.3 | 201 | 2.8 | 1.4 | 207 | 3.9 | 1.0 | 47 | 4.1 | 1.1 | 560 | 3.4 | 1.3 | * |
| Financial coverage for health and mental care | 106 | 3.7 | 1.2 | 134 | 3.1 | 1.3 | 107 | 3.9 | 1.0 | 35 | 3.7 | 1.4 | 382 | 3.5 | 1.2 | * |
| Mean of financial services satisfaction | 138 | 3.2 | 0.9 | 1,633 | 3.8 | 0.9 | 287 | 4.0 | 0.7 | 142 | 3.8 | 0.9 | 2,200 | 3.8 | 0.9 | * |
* p-value <0.05; K = Kruskal–Wallis analysis of variance
Table 19 provides an insight into the degree of satisfaction of financial services in the during studies phase. The table presents number of answers, means, and standard deviations for each specific need among countries, together with Kruskal-Wallis (non-parametric) tests. Finland shows the highest satisfaction rate (4.0) among all the financial services in comparison with the other countries. In particular, in Finland the availability of special benefit for student canteen (4.5) and the possibility to borrow books from library free of charge (4.5) are the services which show a higher satisfaction rate among all the other services. In Italy, the availability to use restaurant tickets at canteen (3.8) has a high satisfaction rate. Moreover, in Poland the availability of scholarships to cover tuition fee (3.8), the possibility to get degree awards (3.8) and the availability of special menu discount price for student in off-campus restaurant (3.8) have a higher satisfaction rate in comparison with other service. To the opposite, Croatia shows a lower satisfaction rate regarding financial services (3.2). The availability to use vouchers to rent a car or buy gas (2.2) is the service with the lowest satisfaction rate in comparison with all the other countries. Finally, the distribution of statistics highlights that the degree of satisfaction of each financial service diverges among different countries, since Kruskal-Wallis tests are significant at a statistical level of 0.05 for all the financial services in the during studies phase.
Table 20 – Health and psychological services in the during studies phase: the satisfaction
| Croatia | Italy | Finland | Poland | Total | K | |||||||||||
| N | M | SD | N | M | SD | N | M | SD | N | M | SD | N | M | SD | ||
| Primary health care services | 160 | 3.7 | 0,9 | 283 | 3.6 | 1.2 | 191 | 3.8 | 0.9 | 84 | 3.6 | 1.1 | 718 | 3.7 | 1,1 | |
| Specialist health care services | 124 | 3.6 | 1,0 | 208 | 3.6 | 1.1 | 179 | 3.9 | 0.9 | 50 | 3.5 | 1.1 | 561 | 3.7 | 1,0 | * |
| Mental health care services | 50 | 3.3 | 1,2 | 139 | 3.4 | 1.3 | 77 | 3.7 | 1.1 | 21 | 3.5 | 1.5 | 287 | 3.5 | 1,3 | |
| Pastoral support | 79 | 3.9 | 1,1 | 104 | 3.8 | 1.3 | 10 | 3.8 | 1.3 | 41 | 3.8 | 1.1 | 234 | 3.8 | 1,2 | |
| Mean of health and psychological services satisfaction | 163 | 3.7 | 0,9 | 479 | 3.6 | 1.1 | 226 | 3.8 | 0.8 | 97 | 3.6 | 1.0 | 965 | 3.7 | 1,0 | |
* p-value <0.05; K = Kruskal–Wallis analysis of variance
Table 20 provides an insight into the degree of satisfaction of health and psychological services in the during studies phase. The table presents number of answers, means, and standard deviations for each specific need among countries, together with Kruskal-Wallis (non-parametric) tests. Finland shows the highest satisfaction rate of all the health and psychological services (3.8). Pastoral support service displays the highest satisfaction rate in Croatia (3.9). On the other side, Italy and Poland (3.6) show the lowest satisfaction rate among primary and specialist care services. Kruskal-Wallis tests are not significant referring to three out of four health and psychological services, highlighting that the degree of satisfaction of health and psychological services don’t diverge among different countries.
Table 21 – Personal development services in the during studies phase: the satisfaction
| Croatia | Italy | Finland | Poland | Total | K | |||||||||||
| N | M | SD | N | M | SD | N | M | SD | N | M | SD | N | M | SD | ||
| Possibility to be engaged in volunteer jobs | 158 | 3.9 | 1.0 | 315 | 3.4 | 1.2 | 27 | 4.1 | 0.9 | 69 | 3.9 | 1.0 | 569 | 3.6 | 1.1 | * |
| Opportunities of occasional jobs during studies | 168 | 3.0 | 1.3 | 375 | 3.1 | 1.3 | 59 | 3.6 | 1.1 | 41 | 3.1 | 1.4 | 643 | 3.1 | 1.3 | * |
| Tutoring advisor | 173 | 3.3 | 1.0 | 1,150 | 3.2 | 1.1 | 90 | 3.6 | 1.0 | 14 | 3.8 | 1.1 | 1,427 | 3.2 | 1.1 | * |
| Educational programs for developing academic and learning skills | 172 | 3.3 | 1.1 | 712 | 3.3 | 1.0 | 70 | 3.3 | 0.8 | 60 | 3.5 | 1.1 | 1,014 | 3.3 | 1.0 | |
| Cultural activities for students | 194 | 3.2 | 1.3 | 1,052 | 3.5 | 1.0 | 59 | 3.8 | 0.9 | 80 | 3.6 | 1.2 | 1,385 | 3.5 | 1.1 | * |
| Programs for student exchange and studies abroad | 135 | 3.1 | 1.2 | 407 | 3.6 | 1.3 | 28 | 4.2 | 0.9 | 19 | 4.1 | 1.3 | 589 | 3.5 | 1.3 | * |
| Counseling for development of personal skills and ambitions | 125 | 2.9 | 1.1 | 409 | 3.3 | 1.1 | 70 | 3.8 | 0.9 | 85 | 3.9 | 1.1 | 795 | 3.1 | 1.1 | * |
| Student unions | 123 | 3.1 | 1.3 | 241 | 3.1 | 1.1 | 42 | 3.5 | 1.0 | 33 | 3.7 | 1.1 | 687 | 3.4 | 1.2 | * |
| Publishing activities | 91 | 2.4 | 1.3 | 315 | 3.4 | 1.2 | 27 | 4.1 | 0.9 | 69 | 3.9 | 1.0 | 407 | 3.0 | 1.2 | * |
| Mean of personal development services satisfaction | 221 | 3.3 | 0.9 | 1,764 | 3.4 | 0.9 | 101 | 3.7 | 0.6 | 119 | 3.7 | 0.9 | 2,205 | 3.4 | 0.9 | * |
* p-value <0.05; K = Kruskal–Wallis analysis of variance
Table 21 provides an insight into the degree of satisfaction of personal development services in the during studies phase. The table presents number of answers, means, and standard deviations for each specific need among countries, together with Kruskal-Wallis (non-parametric) tests. Finland and Poland show the highest satisfaction rate on the average of all personal development services (3.7). In Finland, the possibility to be engaged in volunteer jobs (4.1) and the availability of programs for student exchange and studies abroad (4.2) are the services with the higher satisfaction rate in comparison with all the other countries. Further, Poland displays also a higher satisfaction rate concerning counseling services for development of personal skills and ambition (3.9) and publishing activities (3.9). To the opposite, in Croatia, publishing activities (2.4) and the availability of occasional job opportunities during studies (3.0) represent the lowest satisfaction rate in comparison with all the others countries. The distribution of statistics highlights that the degree of satisfaction of each personal development service diverges among different countries, since Kruskal-Wallis tests are significant at a statistical level of 0.05 for almost the personal development services in the during studies phase. Kruskal-Wallis tests are not significant referring to one out of personal development services.
Table 22 – Sport services in the during studies phase: the satisfaction
| Croatia | Italy | Finland | Poland | Total | K | |||||||||||
| N | M | SD | N | M | SD | N | M | SD | N | M | SD | N | M | SD | ||
| Intra and intercollegiate athletics | 41 | 3.0 | 1.1 | 133 | 3.2 | 1.2 | 51 | 3.7 | 1.0 | 45 | 3.7 | 1.1 | 270 | 3.4 | 1.2 | * |
| Fitness program in a campus-based sports center | 53 | 3.0 | 1.3 | 82 | 3.0 | 1.3 | 110 | 3.7 | 1.0 | 38 | 3.7 | 0.9 | 283 | 3.3 | 1.2 | * |
| Mean of sport services satisfaction | 59 | 3.0 | 1.1 | 183 | 3.3 | 1.2 | 119 | 3.7 | 0.9 | 64 | 3.7 | 1.0 | 425 | 3.4 | 1.1 | * |
* p-value <0.05; K = Kruskal–Wallis analysis of variance
Table 22 provides an insight into the degree of satisfaction of sport services in the during studies phase. The table presents number of answers, means, and standard deviations for each specific need among countries, together with Kruskal-Wallis (non-parametric) tests. On average, sport services show the highest satisfaction rate (3.7) in Finland and Poland and less in Croatia (3.0). Finally, the distribution of statistics highlights that the degree of satisfaction of each sport service diverges among different countries, since Kruskal-Wallis tests are significant at a statistical level of 0.05 for all the sport services in the during studies phase.
The exit phase
Table 23 – Services in the exit phase in the during studies phase: the satisfaction
| Croatia | Italy | Finland | Poland | Total | K | |||||||||||
| N | M | SD | N | M | SD | N | M | SD | N | M | SD | N | M | SD | ||
| Career orientation meeting with an advisor | 54 | 3.3 | 1.2 | 510 | 3.1 | 1.3 | 16 | 3.3 | 1.4 | 44 | 3.3 | 1.2 | 624 | 3.1 | 1.3 | |
| A database of available jobs and placements to help students in finding work opportunities | 79 | 3.1 | 1.3 | 1,273 | 2.8 | 1.2 | 79 | 3.5 | 1.1 | 74 | 3.1 | 1.2 | 1,505 | 2.8 | 1.2 | * |
| A meeting with alumni | 50 | 3.2 | 1.2 | 814 | 3.2 | 1.1 | 30 | 3.7 | 0.9 | 50 | 3.2 | 1.2 | 944 | 3.2 | 1.1 | * |
| Job interviews simulations | 59 | 3.1 | 1.3 | 419 | 3.2 | 1.3 | 14 | 3.6 | 1.1 | 45 | 3.6 | 1.2 | 537 | 3.2 | 1.3 | |
| CV-development workshop | 72 | 3.1 | 1.3 | 582 | 3.3 | 1.2 | 28 | 3.5 | 1.2 | 51 | 3.3 | 1.2 | 733 | 3.3 | 1.2 | |
| Mean of satisfaction in the exit phase | 94 | 3.0 | 1.1 | 2,020 | 3.0 | 1.1 | 89 | 3.5 | 0.9 | 104 | 3.1 | 1.0 | 2,307 | 3.0 | 1.1 | * |
* p-value <0.05; K = Kruskal–Wallis analysis of variance
Table 23 provides an insight into the degree of satisfaction of services in the exit phase. The table presents number of answers, means, and standard deviations for each specific need among countries, together with Kruskal-Wallis (non-parametric) tests. On average, Finland is the country with the highest satisfaction rate concerning the overall services in the exit phase. In particular, a meeting with alumni (3.7) and a database with available job opportunities (3.5) are the most satisfied services in Finland. To the opposite, in Italy and in Croatia (3.0) the satisfaction rate of services in the exit phase is lower. In fact, the availability of a database with job opportunities has the lowest satisfaction rate in Italy (2.8) and job interview simulations and CV development workshop (3.1) are the service with a lower degree of satisfaction in Croatia. The distribution of statistics highlights that the degree of satisfaction of each service in the exit phase diverges among different countries, since Kruskal-Wallis tests are significant at a statistical level of 0.05 for almost the services in the exit phase. Kruskal-Wallis tests are not significant referring to three out of personal development services.
A focus on international students
Table 24 – Perceived of international students needs’ importance
| Italy (n. 187) |
Finland (n. 32) |
Poland (n. 8) |
Total (n. 227) |
K | |||||
| M | SD | M | SD | M | SD | M | SD | ||
| Support to the student for pre-departure | 3.8 | 1.0 | 3.2 | 1.2 | 3.4 | 0.8 | 3.7 | 1.0 | * |
| Support to the student in finding and understanding information | 4.0 | 1.0 | 3.8 | 1.1 | 3.4 | 1.0 | 3.9 | 1.0 | |
| Support to the student in improving the level of knowledge of the host country’s language | 3.8 | 1.2 | 3.7 | 1.1 | 3.4 | 1.0 | 3.7 | 1.1 | |
| Support to the student through additional economic support either by institutions of the country of origin or by the host institution | 4.1 | 1.0 | 4.2 | 0.9 | 3.7 | 0.8 | 4.1 | 1.0 | |
| Support to the students in dealing with administrative procedures | 4.1 | 0.8 | 3.6 | 1.1 | 3.7 | 0.8 | 4.0 | 0.9 | * |
| Support to the students in dealing with academic tasks | 3.9 | 0.9 | 3.6 | 1.0 | 3.4 | 1.0 | 3.9 | 0.9 | |
| Support to the students in looking for internship, part-time or full-time, paid/unpaid job opportunities | 4.3 | 0.9 | 4.0 | 1.3 | 3.6 | 1.1 | 4.2 | 1.0 | * |
| Support to the students about health issues | 3.9 | 1.0 | 3.8 | 1.0 | 3.4 | 1.1 | 3.9 | 1.0 | * |
| Mean of international students need | 3.9 | 0.7 | 3.7 | 0.8 | 3.5 | 0.8 | 3.9 | 0.7 | |
* p-value <0.05; K = Kruskal–Wallis analysis of variance
Table 24 provides an insight into the degree of need’s perceived importance of international students. The table presents means, standard deviations for each specific need among Italy, Finland and Poland, together with Kruskal-Wallis (non-parametric) tests. On average, in Italy all the international students’ needs are perceived as more important (3.9) in comparison with all the other countries. In particular, the need to support students in looking for internships and job opportunities (4.3) and the need to support students through additional economic support either by institutions of the country of origin or by the host institution (4.1) are perceived as more important in Italy. To the opposite, in Poland, the need to support students in finding and understanding information (3.4) and the need to support students in improving the level of knowledge of the host country’s language (3.4) are perceived as less important in Poland in comparison with all the other countries. The distribution of statistics highlights that the degree of importance of each need for international students diverges among different countries, since Kruskal-Wallis tests are significant at a statistical level of 0.05 for almost the international students’ needs. Kruskal-Wallis tests are not significant referring to five out of nine international students’ needs.
Table 25 – International students’ services: the utilization
| Italy | Finland | Poland | Total | K | |||||||||
| N | M(%) | SD(%) | N | (%) | SD(%) | N | M(%) | SD(%) | N | M(%) | SD(%) | ||
| Website and brochure about offered study programs in the language of the host country (or in English) | 165 | 50.9 | 50.1 | 27 | 81.5 | 39.6 | 8 | 75.0 | 46.3 | 200 | 56.0 | 49.8 | * |
| Mobility program announced on time | 162 | 24.7 | 43.3 | 21 | 28.6 | 46.3 | 6 | 33.3 | 51.6 | 189 | 25.4 | 43.6 | |
| Presence of staff to support students with VISA and residency application requirements | 160 | 20.6 | 40.6 | 28 | 50.0 | 50.9 | 7 | 57.1 | 53.5 | 195 | 26.2 | 44.1 | * |
| Information on costs of living in the host country | 155 | 29.7 | 45.8 | 25 | 72.0 | 45.8 | 7 | 57.1 | 53.5 | 187 | 36.4 | 48.2 | * |
| Welcome day for international students | 167 | 35.9 | 48.1 | 24 | 54.2 | 50.9 | 6 | 33.3 | 51.6 | 197 | 38.1 | 48.7 | |
| “Buddy” system/tutorship | 165 | 19.4 | 39.7 | 27 | 37.0 | 49.2 | 7 | 71.4 | 48.8 | 199 | 23.6 | 42.6 | * |
| Local language courses | 165 | 24.8 | 43.3 | 29 | 79.3 | 41.2 | 8 | 75.0 | 46.3 | 202 | 34.7 | 47.7 | * |
| Medical care services | 163 | 22.7 | 42.0 | 24 | 83.3 | 38.1 | 8 | 75.0 | 46.3 | 195 | 32.3 | 46.9 | * |
| Mental health services | 161 | 9.9 | 30.0 | 26 | 30.8 | 47.1 | 7 | 42.9 | 53.5 | 194 | 13.9 | 34.7 | * |
| Extra-curricular activities | 158 | 20.3 | 40.3 | 25 | 40.0 | 50.0 | 7 | 71.4 | 48.8 | 190 | 24.7 | 43.3 | * |
| Additional scholarship for international students | 159 | 34.0 | 47.5 | 25 | 36.0 | 49.0 | 7 | 71.4 | 48.8 | 191 | 35.6 | 48.0 | |
| Help from university to find internship, part-time, full-time paid/unpaid job opportunities | 160 | 26.3 | 44.1 | 24 | 33.3 | 48.2 | 7 | 57.1 | 53.5 | 191 | 28.3 | 45.2 | |
| Housing services | 163 | 22.7 | 42.0 | 30 | 83.3 | 37.9 | 8 | 75.0 | 46.3 | 201 | 33.8 | 47.4 | * |
| Mean of international students’ services utilization | 176 | 28.2 | 31.3 | 31 | 58.1 | 28.7 | 8 | 64.0 | 38.1 | 215 | 33.9 | 33.3 | * |
* p-value <0.05; K = Kruskal–Wallis analysis of variance
Table 25 provides an insight into the degree of utilization of international students’ services. The table presents number of answers, means, and standard deviations for each specific need among countries, together with Kruskal-Wallis (non-parametric) tests. In Poland, all the international students’ services show the higher degree of utilization (64, 0%). In particular, the buddy system tutorship, extra-curriculum activities and additional scholarships for international students (71, 4%) are the most used services in Poland in comparison with all the other countries. Further, in Finland, medical care services and housing services show the higher degree of utilization (83, 3%). To the opposite, in Italy, almost of services for international students are less used (28, 2%) in comparison with all the other countries. In particular, mental health services show the lowest usage rate (9, 9%). The distribution of statistics highlights that the degree of utilization of each service for international students diverges among different countries, since Kruskal-Wallis tests are significant at a statistical level of 0.05 for almost the international students’ services. Kruskal-Wallis tests are not significant referring to four out of fourteen international students’ services.
Table 26 – International students’ services: the satisfaction
| Italy | Finland | Poland | Total | K | |||||||||
| N | M | SD | N | M | SD | N | M | SD | N | M | SD | ||
| Website and brochure about offered study programs in the language of the host country | 84 | 3.1 | 1.1 | 22 | 3.1 | 1.3 | 6 | 2.8 | 1.3 | 112 | 3.1 | 1.2 | |
| Mobility program announced on time | 40 | 3.2 | 1.3 | 6 | 2.8 | 0.8 | 2 | 2.0 | 0.0 | 48 | 3.1 | 1.2 | |
| Presence of staff to support students with VISA and residency application requirements | 33 | 3.6 | 1.1 | 14 | 3.5 | 1.2 | 4 | 2.3 | 0.5 | 51 | 3.5 | 1.2 | |
| Information on costs of living in the host country | 46 | 3.1 | 1.2 | 18 | 3.5 | 1.0 | 4 | 2.3 | 0.5 | 68 | 3.1 | 1.1 | |
| Welcome day for international students | 60 | 3.6 | 1.1 | 13 | 3.5 | 1.1 | 2 | 2.0 | 0.0 | 75 | 3.5 | 1.1 | |
| “Buddy” system/tutorship | 32 | 3.4 | 1.3 | 10 | 3.0 | 1.1 | 5 | 2.6 | 1.3 | 47 | 3.2 | 1.3 | |
| Local language courses | 41 | 3.6 | 1.3 | 23 | 3.3 | 1.2 | 6 | 3.2 | 1.2 | 70 | 3.5 | 1.2 | |
| Medical care services | 37 | 3.1 | 1.2 | 20 | 3.7 | 0.9 | 6 | 2.8 | 1.2 | 63 | 3.3 | 1.1 | |
| Mental health services | 16 | 3.3 | 1.4 | 8 | 3.6 | 0.5 | 3 | 2.7 | 1.2 | 27 | 3.3 | 1.2 | |
| Extra-curricular activities | 32 | 3.1 | 1.2 | 10 | 2.9 | 0.9 | 5 | 2.2 | 0.4 | 47 | 3.0 | 1.1 | |
| Additional scholarship for international students | 54 | 3.4 | 1.5 | 9 | 1.9 | 1.3 | 5 | 2.4 | 1.1 | 68 | 3.1 | 1.5 | * |
| Help from university to find internship, part-time, full-time paid/unpaid job opportunities | 42 | 2.7 | 1.5 | 8 | 2.3 | 1.0 | 4 | 2.0 | 0.8 | 54 | 2.6 | 1.4 | |
| Housing services | 37 | 3.2 | 1.5 | 25 | 3.4 | 1.1 | 6 | 2.5 | 1.0 | 68 | 3.2 | 1.3 | |
| Mean of international students’ services satisfaction | 137 | 3.3 | 1.0 | 29 | 3.4 | 0.8 | 8 | 2.8 | 0.5 | 174 | 3.3 | 1.0 | |
* p-value <0.05; K = Kruskal–Wallis analysis of variance
Table 26 provides an insight into the degree of satisfaction about international students’ services. The table presents number of answers, means, and standard deviations for each specific service among countries, together with Kruskal-Wallis (non-parametric) tests. On average, in Finland, the satisfaction rate of international services’ services is higher (3.4) in comparison with all the other countries. In particular, medical care (3.7) and mental health services (3.6) show a higher satisfaction rate in Finland than in other countries. To the opposite, Poland shows the lowest satisfaction rate among all international students’ services (2.8). Specifically, the announced time of the mobility program has the lowest satisfaction rate (2.0) in comparison with all the other services in Poland. Kruskal-Wallis tests are not significant referring to thirteen out of fourteen international students’ services, highlighting that the degree of satisfaction of international students’ services don’t diverge among different countries.
A focus on student with disabilities
Table 27 – Perceived of student with disabilities needs’ importance
| Italy (n. 81) | Finland (n. 16) | Poland (n. 32) | Total (n. 129) | K | |||||
| M | SD | M | SD | M | SD | M | SD | ||
| Need of physical assistance for disabled students | 3.3 | 1.5 | 3.2 | 1.3 | 3.3 | 1.4 | 3.3 | 1.4 | |
| Need to receive additional assistive tools for disabilities | 3.7 | 1.3 | 3.7 | 0.9 | 3.9 | 1.5 | 3.8 | 1.3 | |
| Need to use specific facilities to access the campus | 3.9 | 1.4 | 3.7 | 1.3 | 3.7 | 1.3 | 3.8 | 1.4 | * |
| Need to attend sport competition and fitness program for disabled students | 2.5 | 1.3 | 2.6 | 1.3 | 3.4 | 1.2 | 2.7 | 1.3 | * |
| Mean of student with disabilities need | 3.4 | 1.1 | 3.3 | 1.0 | 3.5 | 1.1 | 3.4 | 1.1 | * |
* p-value <0.05; K = Kruskal–Wallis analysis of variance
Table 27 provides an insight into the degree of need’s perceived importance of international students. The table presents means, standard deviations for each specific need among Italy, Finland and Poland, together with Kruskal-Wallis (non-parametric) tests. On average, the needs of student with disabilities are perceived as more important in Poland (3.5) and in Italy (3.4). Specifically, the need to receive physical assistance (3.3) is highest in Italy, while the need to receive additional services tools for student with disabilities is more important in Italy and in Finland (3.7). To the opposite, in Croatia, there are no students with disabilities. The distribution of statistics highlights that the degree of importance of each service for student with disabilities diverges among different countries, since Kruskal-Wallis tests are significant at a statistical level of 0.05 for almost the student with disabilities’ services. Kruskal-Wallis tests are not significant referring to two out of five student with disabilities’ services.
Table 28 – Students with disabilities’ services: the utilization
| Italy | Finland | Poland | Total | K | |||||||||
| N | M (%) |
SD(%) | N | M(%) | SD(%) | N | M(%) | SD(%) | N | M(%) | SD(%) | ||
| Availability of appropriate IT facilities | 69 | 18.8 | 39.4 | 13 | 38.5 | 50.6 | 29 | 48.3 | 50.9 | 111 | 28.8 | 45.5 | * |
| Availability of accessible facilities to provide a comfortable access on campus | 72 | 37.5 | 48.8 | 12 | 41.7 | 51.5 | 28 | 39.3 | 49.7 | 112 | 38.4 | 48.9 | |
| Availability of tutors for disabled students | 69 | 27.5 | 45.0 | 12 | 16.7 | 38.9 | 28 | 25.0 | 44.1 | 109 | 25.7 | 43.9 | |
| Sport activities for disabled students | 68 | 8.8 | 28.6 | 12 | 0.0 | 0.0 | 29 | 27.6 | 45.5 | 109 | 12.8 | 33.6 | * |
| Mean of student with disabilities services’ utilization | 73 | 24.7 | 33.9 | 15 | 29.4 | 34.9 | 31 | 37.6 | 36.2 | 119 | 28.6 | 34.8 | * |
* p-value <0.05; K = Kruskal–Wallis analysis of variance
Table 28 provides an insight into the degree of utilization of student with disabilities’ services. The table presents number of answers, means, and standard deviations for each specific service among countries, together with Kruskal-Wallis (non-parametric) tests. Specifically, in Poland, all the services for student with disabilities show the higher degree of utilization (37.6%). On the other hand, in Italy the degree of utilization is lower (24.7%). Finally, Finland shows the lowest utilization rate regarding the availability of tutors (16.7%) and sport activities (0%). The distribution of statistics highlights that the degree of utilization of each service for student with disabilities diverges among different countries, since Kruskal-Wallis tests are significant at a statistical level of 0.05 for almost the student with disabilities’ services. Kruskal-Wallis tests are not significant referring to two out of five student with disabilities’ services.
Table 29 – Students with disabilities’ services: the satisfaction
| Italy | Finland | Poland | Total | K | ||||||||||
| N | M | SD | N | M | SD | N | M | SD | N | M | SD | |||
| Availability of appropriate IT facilities | 13 | 3.5 | 1.2 | 5 | 3.2 | 1.3 | 14 | 2.9 | 1.7 | 32 | 3.2 | 1.5 | ||
| Availability of accessible facilities to provide a comfortable access on campus | 27 | 3.3 | 1.2 | 5 | 3.0 | 1.6 | 11 | 2.6 | 1.2 | 43 | 3.1 | 1.2 | ||
| Availability of tutors for disabled students | 19 | 3.4 | 1.3 | 2 | 3.0 | 2.8 | 7 | 3.0 | 1.3 | 28 | 3.3 | 1.4 | ||
| Sport activities for disabled students | 6 | 3.0 | 1.4 | 0 | 8 | 2.1 | 1.0 | 14 | 2.5 | 1.2 | ||||
| Mean of student with disabilities services’ satisfaction | 32 | 3.5 | 1.1 | 9 | 2.9 | 1.4 | 20 | 2.8 | 1.3 | 61 | 3.2 | 1.2 | ||
* p-value <0.05; K = Kruskal–Wallis analysis of variance
Table 29 provides an insight into the degree of satisfaction of student with disabilities’ services. The table presents number of answers, means, and standard deviations for each specific service among countries, together with Kruskal-Wallis (non-parametric) tests. More specifically, in Italy all the services show a higher satisfaction rate on average (3.5). In particular, the availability of appropriate IT facilities (3.5) and the availability of tutors for student with disabilities (3.4) are the services with the highest satisfaction rate in Italy. To the other side, Poland and Finland show the lowest satisfaction rate of services for student with disabilities (2.8). The distribution of statistics highlights that the degree of satisfaction of each student with disabilities’ service doesn’t diverge among different countries, since Kruskal-Wallis tests are not significant.
The WISE Matrix
As showed in the matrix, the aim of the project is to identify what it is called “Red Zone”. The Red zone is the zone that includes services that show the lower degree of satisfaction but the higher degree of importance. Regarding the matrix above, it is clear that the services that are considered in the red zone are: food, housing, financial, health, study and personal development, sport and exit.
Table 30 – The WISE Matrix: A synthetic view
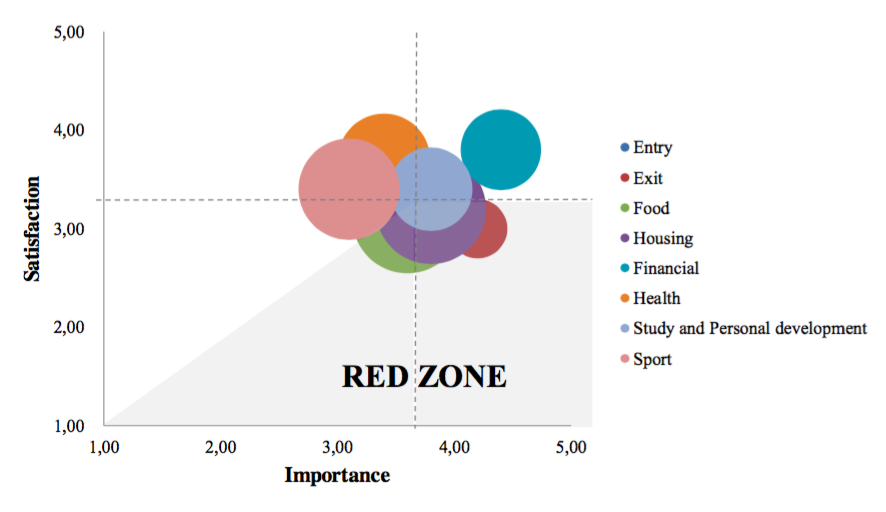
The Matrix below refers only to the special students categories considered: international students and student with disabilities. This WISE Matrix show how services referred to both student with disabilities and international students are in the red zone and so need to be implemented.
Table 31 – The WISE Matrix: Special Categories
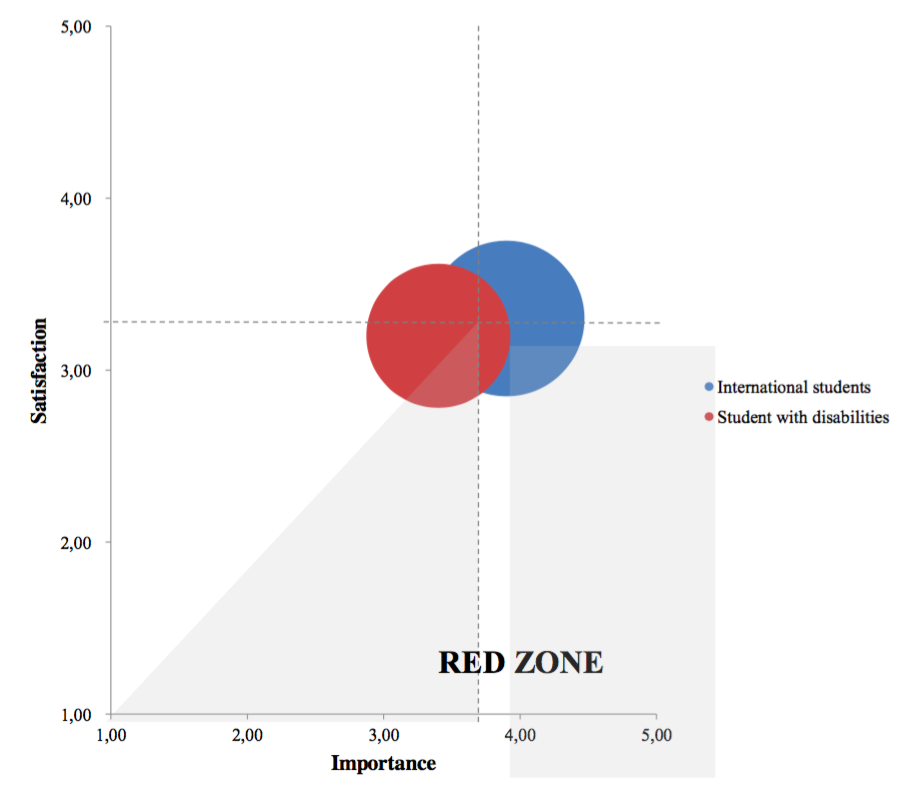
The Matrix below refers only to the services in the during studies phase: food, housing, financial, personal development, health and sport. This WISE Matrix show how services referred to during studies phase are in the red zone and so need to be implemented.
Table 32 – The WISE Matrix: During studies Phase
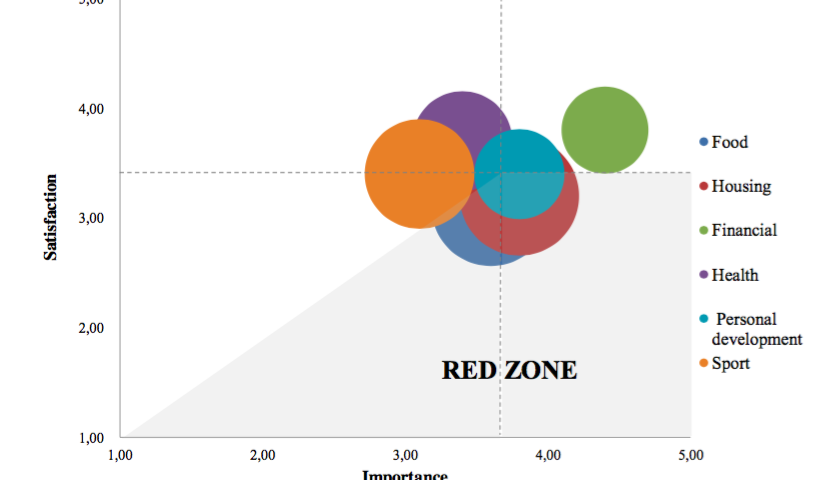
WISE Matrix in Croatia
| Croatia | |||
| Importance | Satisfaction | Utilization (%) |
|
| Entry | 3.7 | 3.6 | 79.3 |
| Food | 3.9 | 2.7 | 93.2 |
| Housing | 3.9 | 3.3 | 74.3 |
| Financial | 4.2 | 3.2 | 36.7 |
| Health | 4.0 | 3.7 | 71.0 |
| Study and personal development | 3.9 | 3.3 | 71.6 |
| Sport | 3.6 | 3.0 | 57.4 |
| Exit | 4.3 | 3.0 | 46.4 |
| Mean | 3.9 | 3.2 | |
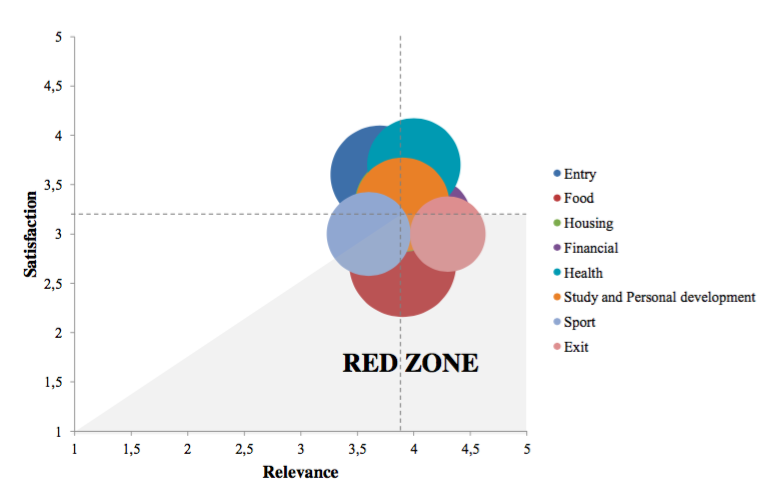
WISE Matrix in Finland
| Finland | |||
| Importance | Satisfaction | Utilization (%) |
|
| Entry | 3.8 | 3.6 | 54.4 |
| Food | 3.5 | 3.7 | 91.2 |
| Housing | 3.9 | 3.8 | 57.5 |
| Financial | 4.1 | 4.0 | 32.6 |
| Health | 4.1 | 3.8 | 54.3 |
| Study and personal development | 3.8 | 3.7 | 63.0 |
| Sport | 3.5 | 3.7 | 55.0 |
| Exit | 3.8 | 3.5 | 31.2 |
| International students | 3.7 | 3.4 | 58.1 |
| Students with disabilities | 3.3 | 2.9 | 29.4 |
| Mean | 3.8 | 3.6 | |
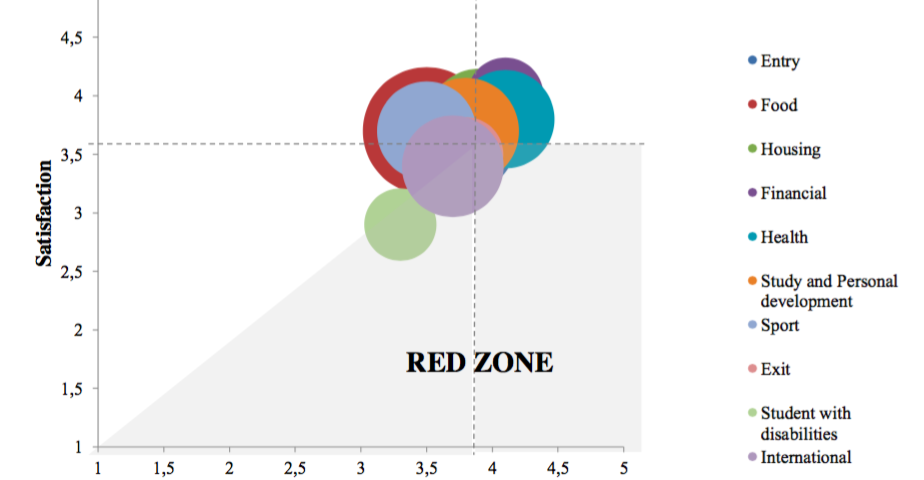
WISE Matrix in Italy
| Italy | |||
| Importance | Satisfaction | Utilization (%) |
|
| Entry | 3.8 | 3.1 | 38.,1 |
| Food | 3.6 | 3.0 | 68.6 |
| Housing | 3.8 | 3.1 | 76.5 |
| Financial | 4.4 | 3.8 | 39.0 |
| Health | 3.4 | 3.6 | 40.5 |
| Study and personal development | 3.8 | 3.4 | 35.9 |
| Sport | 3.1 | 3.3 | 60.9 |
| Exit | 4.3 | 3.0 | 19.0 |
| International students | 3.9 | 3.3 | 28.2 |
| Students with disabilities | 3.4 | 3.5 | 24.7 |
| Mean | 3.8 | 3.3 | |
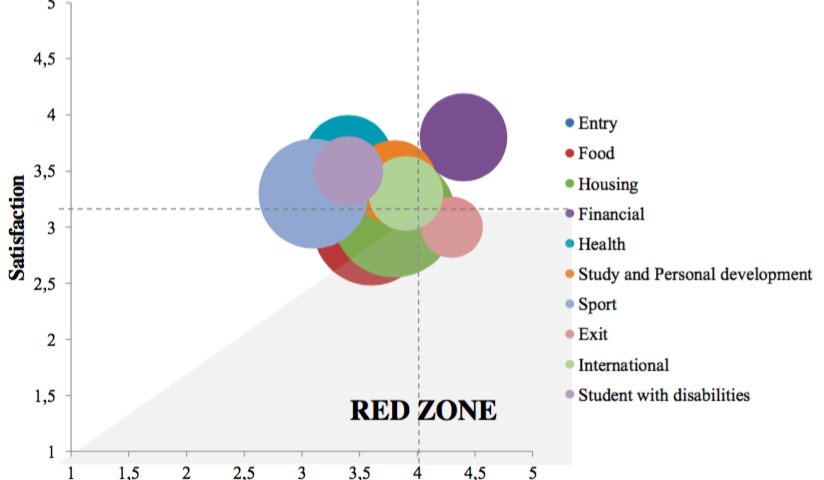
WISE Matrix in Poland
| Poland | |||
| Importance | Satisfaction | Utilization (%) |
|
| Entry | 3.7 | 3.3 | 42.5 |
| Food | 3.3 | 3.3 | 69.0 |
| Housing | 3.7 | 3.2 | 59.6 |
| Financial | 4.2 | 3.8 | 33.4 |
| Health | 3.5 | 3.6 | 56.7 |
| Study and personal development | 3.7 | 3.7 | 46.7 |
| Sport | 3.4 | 3.7 | 65.0 |
| Exit | 4.0 | 3.1 | 35.9 |
| International students | 3.5 | 2.8 | 64.0 |
| Students with disabilities | 3.5 | 2.8 | 37.6 |
| Mean | 3.7 | 3.3 | |